## Line Chart: Test Result on MATH500
### Overview
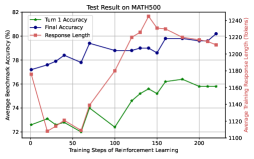
The image is a line chart displaying the test results on MATH500, showing the "Tum 1 Accuracy", "Final Accuracy", and "Response Length" as functions of "Training Steps of Reinforcement Learning". The chart has two y-axes: the left axis represents "Average Benchmark Accuracy (%)" and the right axis represents "Average Training Response Length (Tokens)".
### Components/Axes
* **Title:** Test Result on MATH500
* **X-axis:** Training Steps of Reinforcement Learning
* Scale: 0 to 200, with markers at approximately 0, 50, 100, 150, and 200.
* **Left Y-axis:** Average Benchmark Accuracy (%)
* Scale: 72 to 82, with markers at 72, 74, 76, 78, 80, and 82.
* **Right Y-axis:** Average Training Response Length (Tokens)
* Scale: 1100 to 1240, with markers at 1100, 1120, 1140, 1160, 1180, 1200, 1220, and 1240.
* **Legend:** Located in the top-left corner.
* **Tum 1 Accuracy:** Green line
* **Final Accuracy:** Blue line
* **Response Length:** Red line
### Detailed Analysis
* **Tum 1 Accuracy (Green):**
* Trend: Generally increasing with fluctuations.
* Data Points:
* 0 steps: ~72.5%
* 50 steps: ~72%
* 100 steps: ~72.5%
* 150 steps: ~76%
* 200 steps: ~76%
* **Final Accuracy (Blue):**
* Trend: Initially increasing, then stabilizing.
* Data Points:
* 0 steps: ~77.5%
* 50 steps: ~78%
* 100 steps: ~79%
* 150 steps: ~80%
* 200 steps: ~80%
* **Response Length (Red):**
* Trend: Increasing sharply, peaking around 150 steps, then decreasing.
* Data Points:
* 0 steps: ~1180 tokens
* 50 steps: ~1140 tokens
* 100 steps: ~1170 tokens
* 150 steps: ~1240 tokens
* 200 steps: ~1220 tokens
### Key Observations
* The "Final Accuracy" generally increases and stabilizes as the training steps increase.
* The "Response Length" initially increases significantly, peaks, and then decreases slightly.
* "Tum 1 Accuracy" shows a fluctuating but generally increasing trend.
### Interpretation
The chart illustrates the performance of a model on the MATH500 dataset during reinforcement learning. The "Final Accuracy" represents the model's overall accuracy, which improves with more training steps. The "Response Length" indicates the complexity or length of the model's responses, which initially increases as the model learns but may decrease as the model optimizes its responses. The "Tum 1 Accuracy" likely represents an intermediate accuracy metric, showing a less consistent improvement compared to the final accuracy. The data suggests that the model benefits from increased training steps, leading to higher accuracy, but the response length needs to be managed to avoid overly complex or lengthy outputs.