## Line Chart: Test Result on MATH500
### Overview
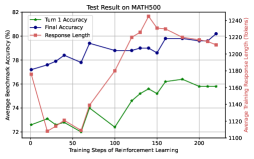
The image presents a line chart displaying the performance of a model on the MATH500 dataset during reinforcement learning. The chart tracks three metrics: Turn 1 Accuracy, Final Accuracy, and Response Length, against the number of Training Steps. The chart appears to be evaluating the model's learning progress.
### Components/Axes
* **Title:** "Test Result on MATH500" (centered at the top)
* **X-axis:** "Training Steps of Reinforcement Learning" (ranging from approximately 0 to 220, with tick marks at intervals of approximately 20)
* **Y-axis (left):** "Average Reasoning Accuracy" (ranging from approximately 72% to 82%, with tick marks at intervals of approximately 2%)
* **Y-axis (right):** "Average Setting Length (tokens)" (ranging from approximately 1100 to 1240, with tick marks at intervals of approximately 20)
* **Legend:** Located in the top-left corner, containing:
* Green Line: "Turn 1 Accuracy"
* Blue Line: "Final Accuracy"
* Red Line: "Response Length"
### Detailed Analysis
* **Turn 1 Accuracy (Green Line):** The line starts at approximately 73% at step 0, decreases to a minimum of around 72% at step 20, then increases to a peak of approximately 77% at step 150, and finally decreases to around 76% at step 220. The trend is generally upward, with some fluctuations.
* Step 0: ~73%
* Step 20: ~72%
* Step 50: ~75%
* Step 100: ~76%
* Step 150: ~77%
* Step 200: ~76%
* **Final Accuracy (Blue Line):** The line begins at approximately 77% at step 0, increases to a maximum of around 81% at step 50, then decreases to approximately 79% at step 100, fluctuates between 79% and 80% until step 150, and finally increases to approximately 81% at step 220. The trend is generally upward, with some oscillations.
* Step 0: ~77%
* Step 20: ~78%
* Step 50: ~81%
* Step 100: ~79%
* Step 150: ~79%
* Step 200: ~81%
* **Response Length (Red Line):** The line starts at approximately 1220 tokens at step 0, decreases sharply to a minimum of around 1160 tokens at step 20, then increases to a peak of approximately 1240 tokens at step 150, and finally decreases to around 1220 tokens at step 220. The trend is initially downward, then strongly upward, and finally slightly downward.
* Step 0: ~1220 tokens
* Step 20: ~1160 tokens
* Step 50: ~1180 tokens
* Step 100: ~1200 tokens
* Step 150: ~1240 tokens
* Step 200: ~1220 tokens
### Key Observations
* The Final Accuracy consistently remains higher than the Turn 1 Accuracy throughout the training process.
* The Response Length initially decreases, suggesting the model is becoming more concise in its early stages of learning, but then increases significantly, potentially indicating the model is generating more detailed or complex responses as it learns.
* There is a correlation between the increase in Final Accuracy and the increase in Response Length between steps 50 and 150.
### Interpretation
The chart suggests that the model is improving its performance on the MATH500 dataset as training progresses. The increase in Final Accuracy indicates that the model is learning to provide more accurate answers. The initial decrease in Response Length could be due to the model learning to eliminate unnecessary information, while the subsequent increase might be due to the model learning to provide more comprehensive explanations or justifications for its answers. The fact that Final Accuracy is consistently higher than Turn 1 Accuracy suggests that the model is refining its responses during the reasoning process. The fluctuations in all three metrics indicate that the learning process is not entirely smooth and that the model may be experiencing periods of both improvement and regression. The data suggests a complex interplay between accuracy and response complexity during the reinforcement learning process.