## Line Graph with Dual Y-Axes: Test Result on MATH500
### Overview
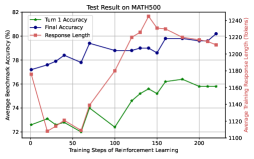
The image is a line graph titled "Test Result on MATH500" that plots three metrics over the course of reinforcement learning training. It uses a dual y-axis design to display two different types of data: accuracy percentages (left axis) and token counts (right axis). The graph shows the progression of model performance and output length across 200 training steps.
### Components/Axes
* **Title:** "Test Result on MATH500" (centered at the top).
* **X-Axis:** Labeled "Training Steps of Reinforcement Learning". It has major tick marks at intervals of 50, ranging from 0 to 200.
* **Primary Y-Axis (Left):** Labeled "Average Accuracy (%)". It ranges from 72 to 82 with major tick marks every 2 units (72, 74, 76, 78, 80, 82).
* **Secondary Y-Axis (Right):** Labeled "Average Response Length (Tokens)". It ranges from 1100 to 1240 with major tick marks every 20 tokens (1100, 1120, 1140, 1160, 1180, 1200, 1220, 1240).
* **Legend:** Positioned at the top center of the chart area. It contains three entries:
1. A blue line with a square marker labeled "Turn 1 Accuracy".
2. A green line with a square marker labeled "Turn 2 Accuracy".
3. A red line with a square marker labeled "Response Length".
### Detailed Analysis
The graph tracks three distinct data series:
**1. Turn 1 Accuracy (Blue Line, Left Y-Axis):**
* **Trend:** Shows a general upward trend with moderate volatility. It starts at a moderate level, experiences a dip, and then recovers to finish at its highest point.
* **Data Points (Approximate):**
* Step 0: ~76.5%
* Step 25: ~76.0% (local minimum)
* Step 50: ~77.0%
* Step 75: ~78.5%
* Step 100: ~78.0%
* Step 125: ~79.5%
* Step 150: ~80.0%
* Step 175: ~79.5%
* Step 200: ~80.5% (peak)
**2. Turn 2 Accuracy (Green Line, Left Y-Axis):**
* **Trend:** Exhibits a more volatile but overall positive trend. It begins at the lowest point of all series, has several peaks and troughs, and ends significantly higher than it started.
* **Data Points (Approximate):**
* Step 0: ~72.5%
* Step 25: ~73.0%
* Step 50: ~72.0% (global minimum)
* Step 75: ~74.5%
* Step 100: ~73.5%
* Step 125: ~75.5%
* Step 150: ~76.0%
* Step 175: ~75.5%
* Step 200: ~76.0%
**3. Response Length (Red Line, Right Y-Axis):**
* **Trend:** Displays a distinct "U-shaped" or recovery trend. It starts high, drops sharply to a minimum in the first quarter of training, and then steadily increases for the remainder, surpassing its initial value.
* **Data Points (Approximate):**
* Step 0: ~1200 tokens
* Step 25: ~1120 tokens (global minimum)
* Step 50: ~1130 tokens
* Step 75: ~1160 tokens
* Step 100: ~1200 tokens
* Step 125: ~1220 tokens
* Step 150: ~1230 tokens
* Step 175: ~1220 tokens
* Step 200: ~1225 tokens
### Key Observations
1. **Inverse Early Relationship:** In the first 50 steps, as Response Length (red) decreases sharply, both accuracy metrics (blue, green) show stagnation or decline. This suggests an initial phase where the model may be learning to be more concise at the cost of accuracy.
2. **Positive Correlation Later:** After step 50, all three metrics trend upward together. The increase in response length from ~1130 to ~1225 tokens coincides with improvements in both Turn 1 and Turn 2 accuracy.
3. **Performance Gap:** Turn 1 Accuracy (blue) is consistently higher than Turn 2 Accuracy (green) throughout the entire training process, with the gap remaining relatively stable at approximately 3-5 percentage points.
4. **Volatility:** Turn 2 Accuracy (green) shows the most pronounced fluctuations, suggesting it is a more sensitive or difficult metric to optimize consistently compared to Turn 1 Accuracy.
### Interpretation
This chart illustrates the dynamics of a reinforcement learning process applied to a mathematical reasoning task (MATH500). The data suggests a multi-phase training evolution:
* **Phase 1 - Compression (Steps 0-50):** The model initially learns to drastically shorten its responses (from 1200 to 1120 tokens). This compression phase appears detrimental to performance, as both accuracy metrics dip or flatline. This could represent the model shedding verbose but incorrect reasoning patterns.
* **Phase 2 - Refinement (Steps 50-200):** The model then enters a phase where it gradually increases its response length again. Crucially, this added length is not mere verbosity; it correlates with a steady improvement in accuracy for both the first and second turns of reasoning. This indicates the model is learning to generate more substantive, correct, and possibly more detailed chains of thought.
* **The Accuracy-Length Trade-off:** The graph challenges a simplistic "shorter is better" view. The optimal performance (at step 200) is achieved with a response length (~1225 tokens) that is *longer* than the initial length, but yields significantly higher accuracy. The key is the *quality* of the tokens generated during the refinement phase.
* **Turn-Based Reasoning:** The persistent gap between Turn 1 and Turn 2 accuracy implies that generating a correct second step of reasoning remains a harder task than the first, even after extensive training. The parallel trends, however, show that improvements in the foundational first-turn reasoning positively influence the more complex second-turn reasoning.
In summary, the chart depicts a successful training run where an initial period of response shortening is followed by a longer period of constructive growth, where increased response length is harnessed to build more accurate multi-step mathematical reasoning.