## Line Graph: Test Result on MATH500
### Overview
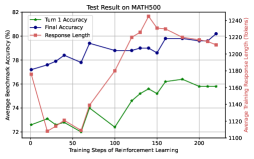
The image is a line graph depicting the performance of a reinforcement learning model on the MATH500 benchmark. It tracks three metrics across 200 training steps: **Turn 1 Accuracy** (green), **Final Accuracy** (blue), and **Response Length** (red). A secondary y-axis on the right measures **Average Training Response Length** (tokens). The graph shows trends in accuracy and response efficiency as training progresses.
---
### Components/Axes
- **X-Axis**: Training Steps of Reinforcement Learning (0 to 200, linear scale).
- **Left Y-Axis**: Average Benchmark Accuracy (%) (72% to 82%).
- **Right Y-Axis**: Average Training Response Length (tokens) (1100 to 1240).
- **Legend**: Located in the top-left corner, with color-coded labels:
- Green: Turn 1 Accuracy
- Blue: Final Accuracy
- Red: Response Length
---
### Detailed Analysis
1. **Turn 1 Accuracy (Green Line)**:
- Starts at ~72.5% at 0 steps.
- Peaks at ~76% around 200 steps, with minor fluctuations (e.g., ~73% at 50 steps, ~75% at 100 steps).
- Shows a general upward trend with plateaus.
2. **Final Accuracy (Blue Line)**:
- Begins at ~77% at 0 steps.
- Rises to ~80% at ~150 steps, then stabilizes (~79.5% at 200 steps).
- Exhibits sharper increases (e.g., ~78.5% at 50 steps, ~79% at 100 steps).
3. **Response Length (Red Line)**:
- Starts at ~1160 tokens at 0 steps.
- Spikes to ~1240 tokens at ~150 steps, then declines to ~1200 tokens at 200 steps.
- Correlates with Final Accuracy’s peak at 150 steps.
---
### Key Observations
- **Accuracy vs. Response Length**: Final Accuracy peaks at the same training step (150) as the Response Length spike, suggesting a temporary trade-off between performance and computational cost.
- **Turn 1 vs. Final Accuracy**: Final Accuracy consistently outperforms Turn 1 Accuracy, indicating reinforcement learning improves response quality over time.
- **Response Length Anomaly**: The sharp increase at 150 steps may reflect model exploration or increased complexity before optimization.
---
### Interpretation
The data demonstrates that reinforcement learning enhances model performance on MATH500, with Final Accuracy surpassing initial results. However, the spike in Response Length at 150 steps implies a potential inefficiency or exploratory phase in the model’s training. The subsequent decline in Response Length alongside stabilized accuracy suggests the model optimizes its reasoning process, balancing accuracy and efficiency. This pattern highlights the importance of monitoring both performance metrics and computational costs during training.