# Technical Data Extraction: Model Performance Comparison
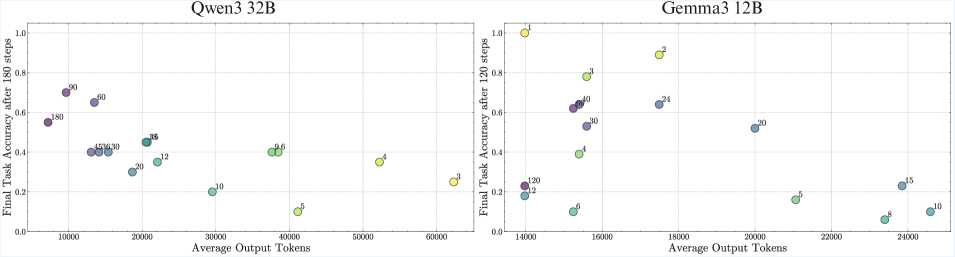
This document provides a detailed extraction of data from two side-by-side scatter plots comparing the performance of two Large Language Models: **Qwen3 32B** and **Gemma3 12B**.
## 1. Document Structure and Global Metadata
The image consists of two distinct panels arranged horizontally.
* **Language:** English.
* **Common X-Axis:** Average Output Tokens.
* **Common Y-Axis:** Final Task Accuracy after [N] steps.
* **Data Representation:** Scatter plot with colored circular markers. Each marker is labeled with a numerical value representing a specific parameter (likely a hyperparameter or configuration setting).
* **Color Gradient:** Both charts use a consistent color mapping where purple/dark blue represents higher numerical labels and yellow/light green represents lower numerical labels.
---
## 2. Panel 1: Qwen3 32B
**Header:** Qwen3 32B
**Y-Axis Label:** Final Task Accuracy after 180 steps
**X-Axis Label:** Average Output Tokens
### Trend Analysis
The data for Qwen3 32B shows a generally **inverse relationship** between average output tokens and accuracy. As the output length increases (moving right on the x-axis), the accuracy tends to decrease. The highest accuracy is achieved at lower token counts (approx. 10,000 tokens).
### Data Point Extraction
| Label (Value) | Approx. X (Tokens) | Approx. Y (Accuracy) | Color Note |
| :--- | :--- | :--- | :--- |
| 180 | 7,000 | 0.55 | Dark Purple |
| 90 | 10,000 | 0.70 | Purple |
| 60 | 14,000 | 0.65 | Purple-Blue |
| 45 | 13,500 | 0.40 | Blue |
| 36 | 14,500 | 0.40 | Blue |
| 30 | 15,500 | 0.40 | Blue |
| 20 | 19,000 | 0.30 | Teal |
| 18 | 21,000 | 0.45 | Teal |
| 15 | 21,000 | 0.45 | Teal |
| 12 | 22,000 | 0.35 | Light Teal |
| 10 | 29,500 | 0.20 | Green |
| 9 | 37,500 | 0.40 | Light Green |
| 6 | 38,500 | 0.40 | Light Green |
| 5 | 41,000 | 0.10 | Yellow-Green |
| 4 | 52,500 | 0.35 | Yellow |
| 3 | 62,500 | 0.25 | Yellow |
---
## 3. Panel 2: Gemma3 12B
**Header:** Gemma3 12B
**Y-Axis Label:** Final Task Accuracy after 120 steps
**X-Axis Label:** Average Output Tokens
### Trend Analysis
The data for Gemma3 12B is more **dispersed** and does not follow a simple linear trend. There is a cluster of high-accuracy points at lower token counts (14,000 - 18,000), but accuracy drops significantly as token counts exceed 20,000. Notably, the labels on this chart appear to be inverted compared to the first chart (lower numerical labels correspond to higher accuracy/lower tokens).
### Data Point Extraction
| Label (Value) | Approx. X (Tokens) | Approx. Y (Accuracy) | Color Note |
| :--- | :--- | :--- | :--- |
| 1 | 14,000 | 1.00 | Yellow |
| 2 | 17,500 | 0.89 | Yellow |
| 3 | 15,500 | 0.78 | Light Green |
| 4 | 15,300 | 0.39 | Light Green |
| 5 | 21,000 | 0.16 | Green |
| 6 | 15,100 | 0.10 | Green |
| 8 | 23,400 | 0.06 | Teal |
| 10 | 24,600 | 0.10 | Teal |
| 12 | 14,000 | 0.18 | Teal |
| 15 | 23,800 | 0.23 | Blue-Teal |
| 20 | 20,000 | 0.52 | Blue |
| 24 | 17,500 | 0.64 | Blue |
| 30 | 15,600 | 0.53 | Purple-Blue |
| 40 | 15,400 | 0.64 | Purple |
| 60 | 15,300 | 0.63 | Purple |
| 120 | 14,000 | 0.23 | Dark Purple |
---
## 4. Comparative Summary
* **Scale:** Qwen3 32B operates across a much wider range of output tokens (up to 60,000+), whereas Gemma3 12B is concentrated between 14,000 and 25,000 tokens.
* **Accuracy:** Gemma3 12B achieves a higher peak accuracy (1.0 at label 1) compared to Qwen3 32B (approx 0.7 at label 90), though it is measured at fewer steps (120 vs 180).
* **Efficiency:** Qwen3 shows a more stable, predictable decay in performance as output length increases, while Gemma3 shows high volatility in the 14k-16k token range.