# Technical Document Extraction: Baseline - Short-to-Long - Qwen-2.5 3B
## 1. Chart Identification
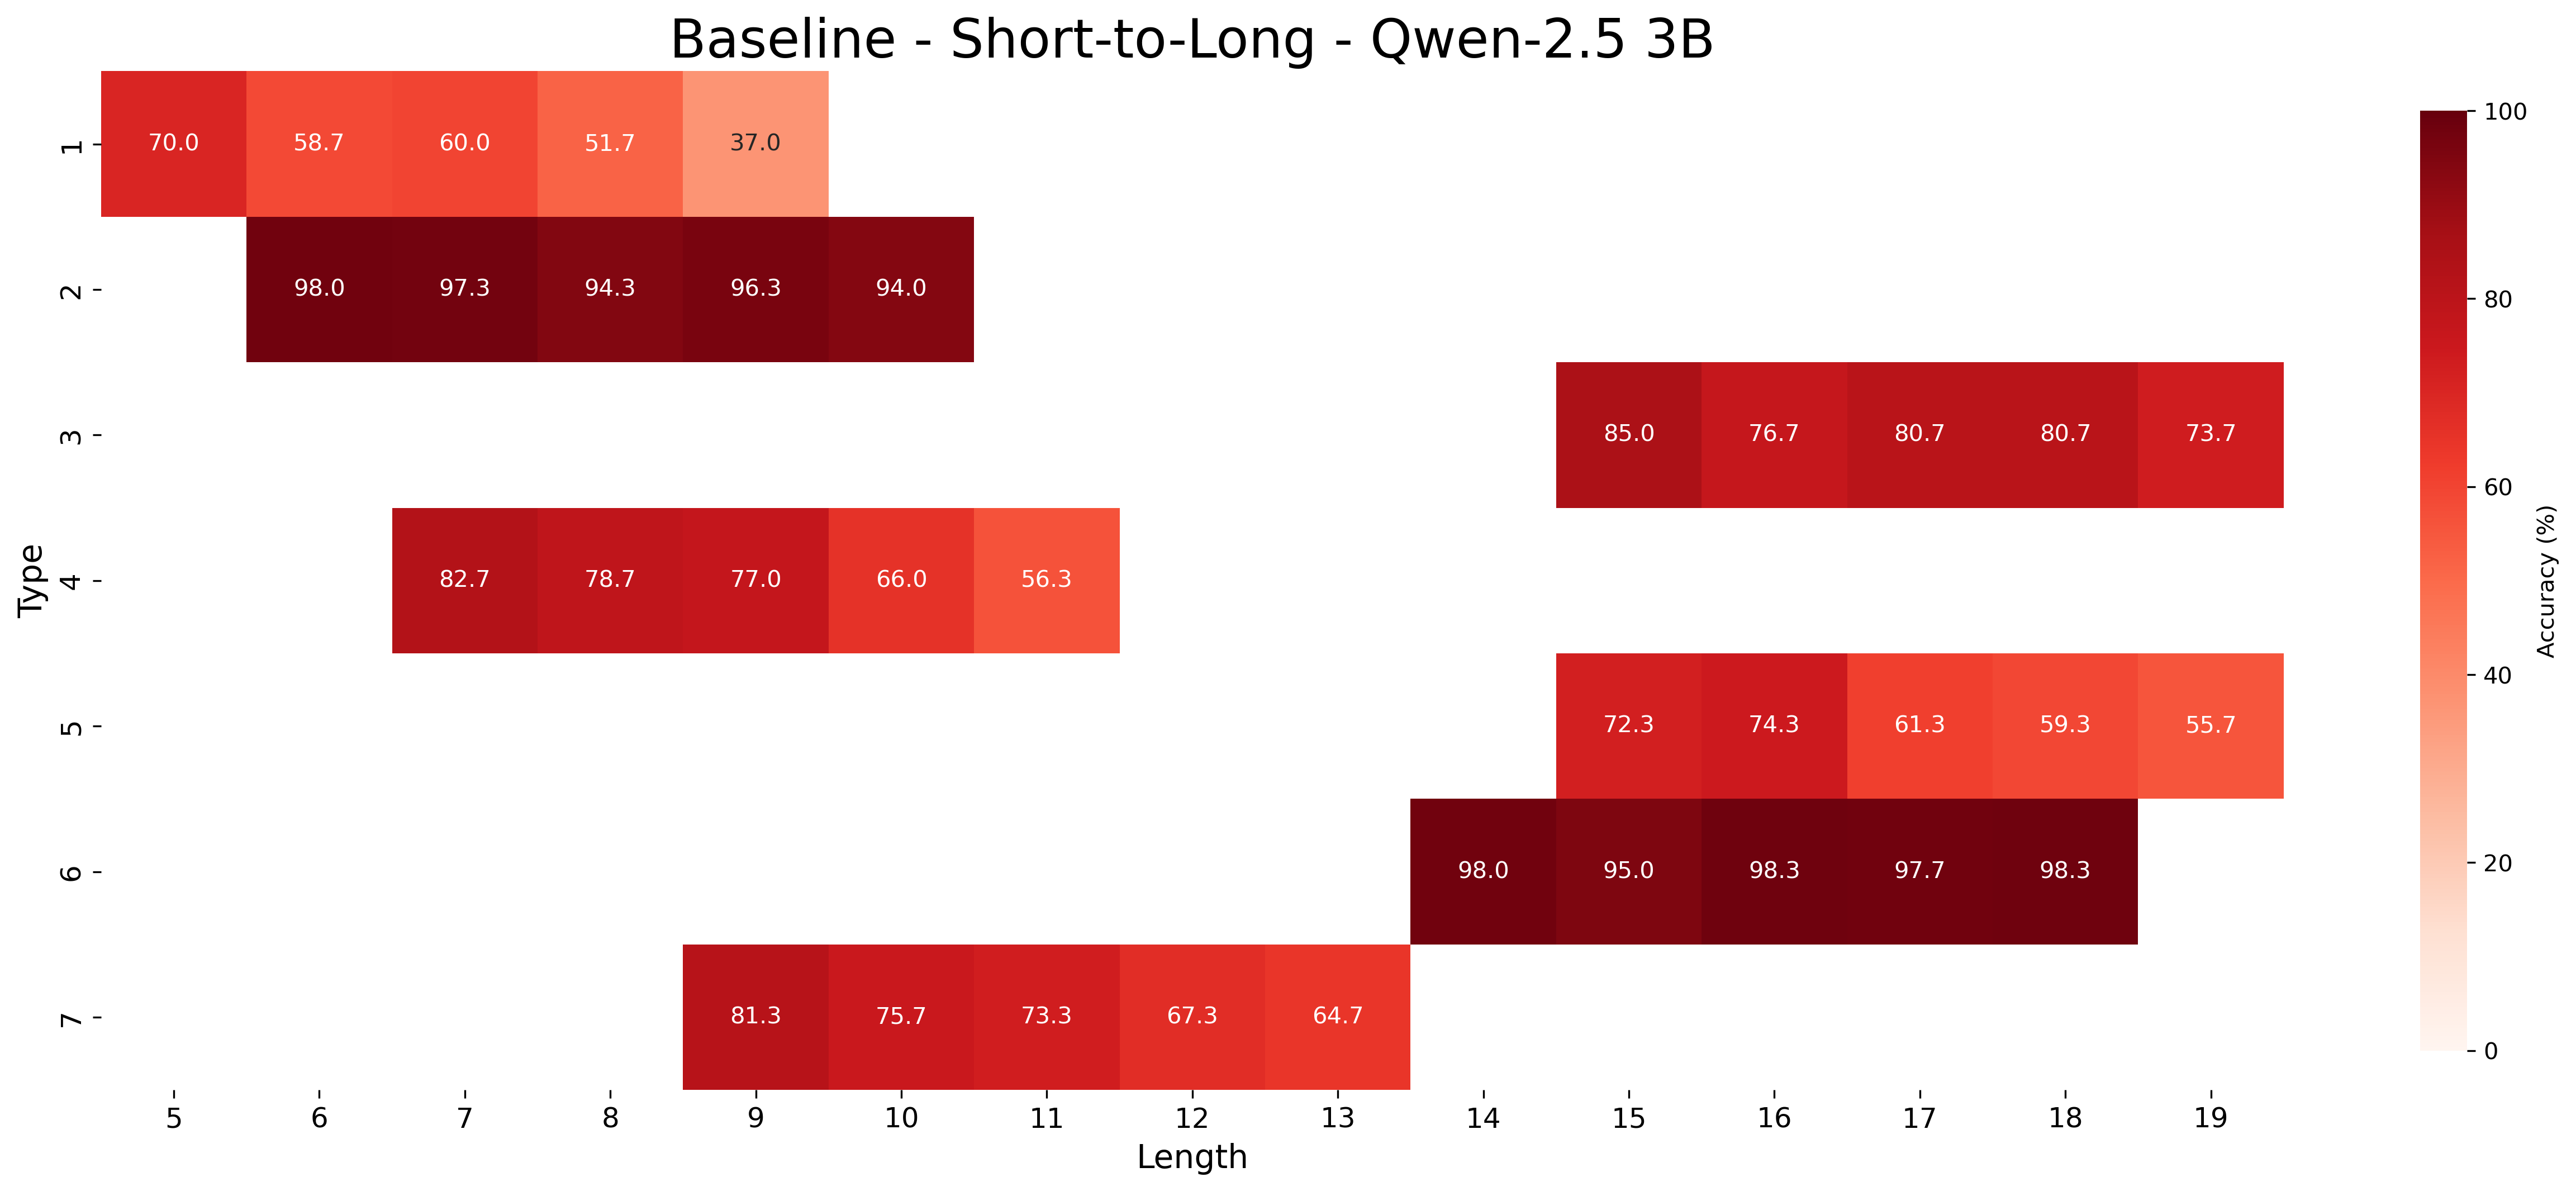
- **Type**: Heatmap
- **Title**: "Baseline - Short-to-Long - Qwen-2.5 3B"
- **Color Legend**: Right-aligned vertical colorbar labeled "Accuracy (%)" with gradient from light orange (0%) to dark red (100%)
## 2. Axis Labels & Markers
- **X-axis (Horizontal)**:
- Label: "Length"
- Values: 5, 6, 7, 8, 9, 10, 11, 12, 13, 14, 15, 16, 17, 18, 19
- **Y-axis (Vertical)**:
- Label: "Type"
- Values: 1, 2, 3, 4, 5, 6, 7
## 3. Data Structure
- **Rows**: 7 (Type 1 to Type 7)
- **Columns**: 15 (Length 5 to Length 19)
- **Cell Values**: Accuracy percentages (e.g., 70.0, 58.7, 60.0, etc.)
## 4. Key Trends & Observations
### Type 1 (Row 1)
- Accuracy peaks at Length 7 (60.0%) then declines sharply to 37.0% at Length 8
- Initial values: 70.0% (Length 5), 58.7% (Length 6)
### Type 2 (Row 2)
- High accuracy across Lengths 6-9 (98.0% to 96.3%)
- Drops to 94.0% at Length 10
### Type 3 (Row 3)
- High accuracy starts at Length 15 (85.0%) with gradual decline to 73.7% at Length 19
### Type 4 (Row 4)
- Peaks at Length 7 (82.7%) with gradual decline to 56.3% at Length 11
### Type 5 (Row 5)
- Peaks at Length 17 (80.7%) with gradual decline to 55.7% at Length 19
### Type 6 (Row 6)
- High accuracy from Length 14 (98.0%) to Length 18 (98.3%)
- Drops to 55.7% at Length 19
### Type 7 (Row 7)
- Gradual decline from 81.3% (Length 9) to 64.7% (Length 13)
## 5. Spatial Grounding
- **Legend Position**: Right side of chart (x=100%, y=0% to y=100%)
- **Color Consistency**: Darker red cells correspond to higher accuracy values (e.g., 98.3% = darkest red)
## 6. Data Table Reconstruction
| Type \ Length | 5 | 6 | 7 | 8 | 9 | 10 | 11 | 12 | 13 | 14 | 15 | 16 | 17 | 18 | 19 |
|---------------|------|------|------|------|------|------|------|------|------|------|------|------|------|------|------|
| 1 | 70.0 | 58.7 | 60.0 | 51.7 | 37.0 | | | | | | | | | | |
| 2 | | 98.0 | 97.3 | 94.3 | 96.3 | 94.0 | | | | | | | | | |
| 3 | | | | | | | | | | | 85.0 | 76.7 | 80.7 | 80.7 | 73.7 |
| 4 | | | 82.7 | 78.7 | 77.0 | 66.0 | 56.3 | | | | | | | | |
| 5 | | | | | | | | | | | 72.3 | 74.3 | 61.3 | 59.3 | 55.7 |
| 6 | | | | | | | | | | 98.0 | 95.0 | 98.3 | 97.7 | 98.3 | |
| 7 | | | | | 81.3 | 75.7 | 73.3 | 67.3 | 64.7 | | | | | | |
## 7. Language Notes
- **Primary Language**: English
- **Secondary Language**: None detected
## 8. Critical Validation Checks
1. **Color-Value Match**: All dark red cells (e.g., 98.3%) align with top of colorbar
2. **Trend Verification**: Type 6 shows plateau at high accuracy (98.0-98.3%) before sharp drop
3. **Axis Consistency**: All row/column labels match positional data