## Heatmap: Baseline - Short-to-Long - Qwen-2.5 3B
### Overview
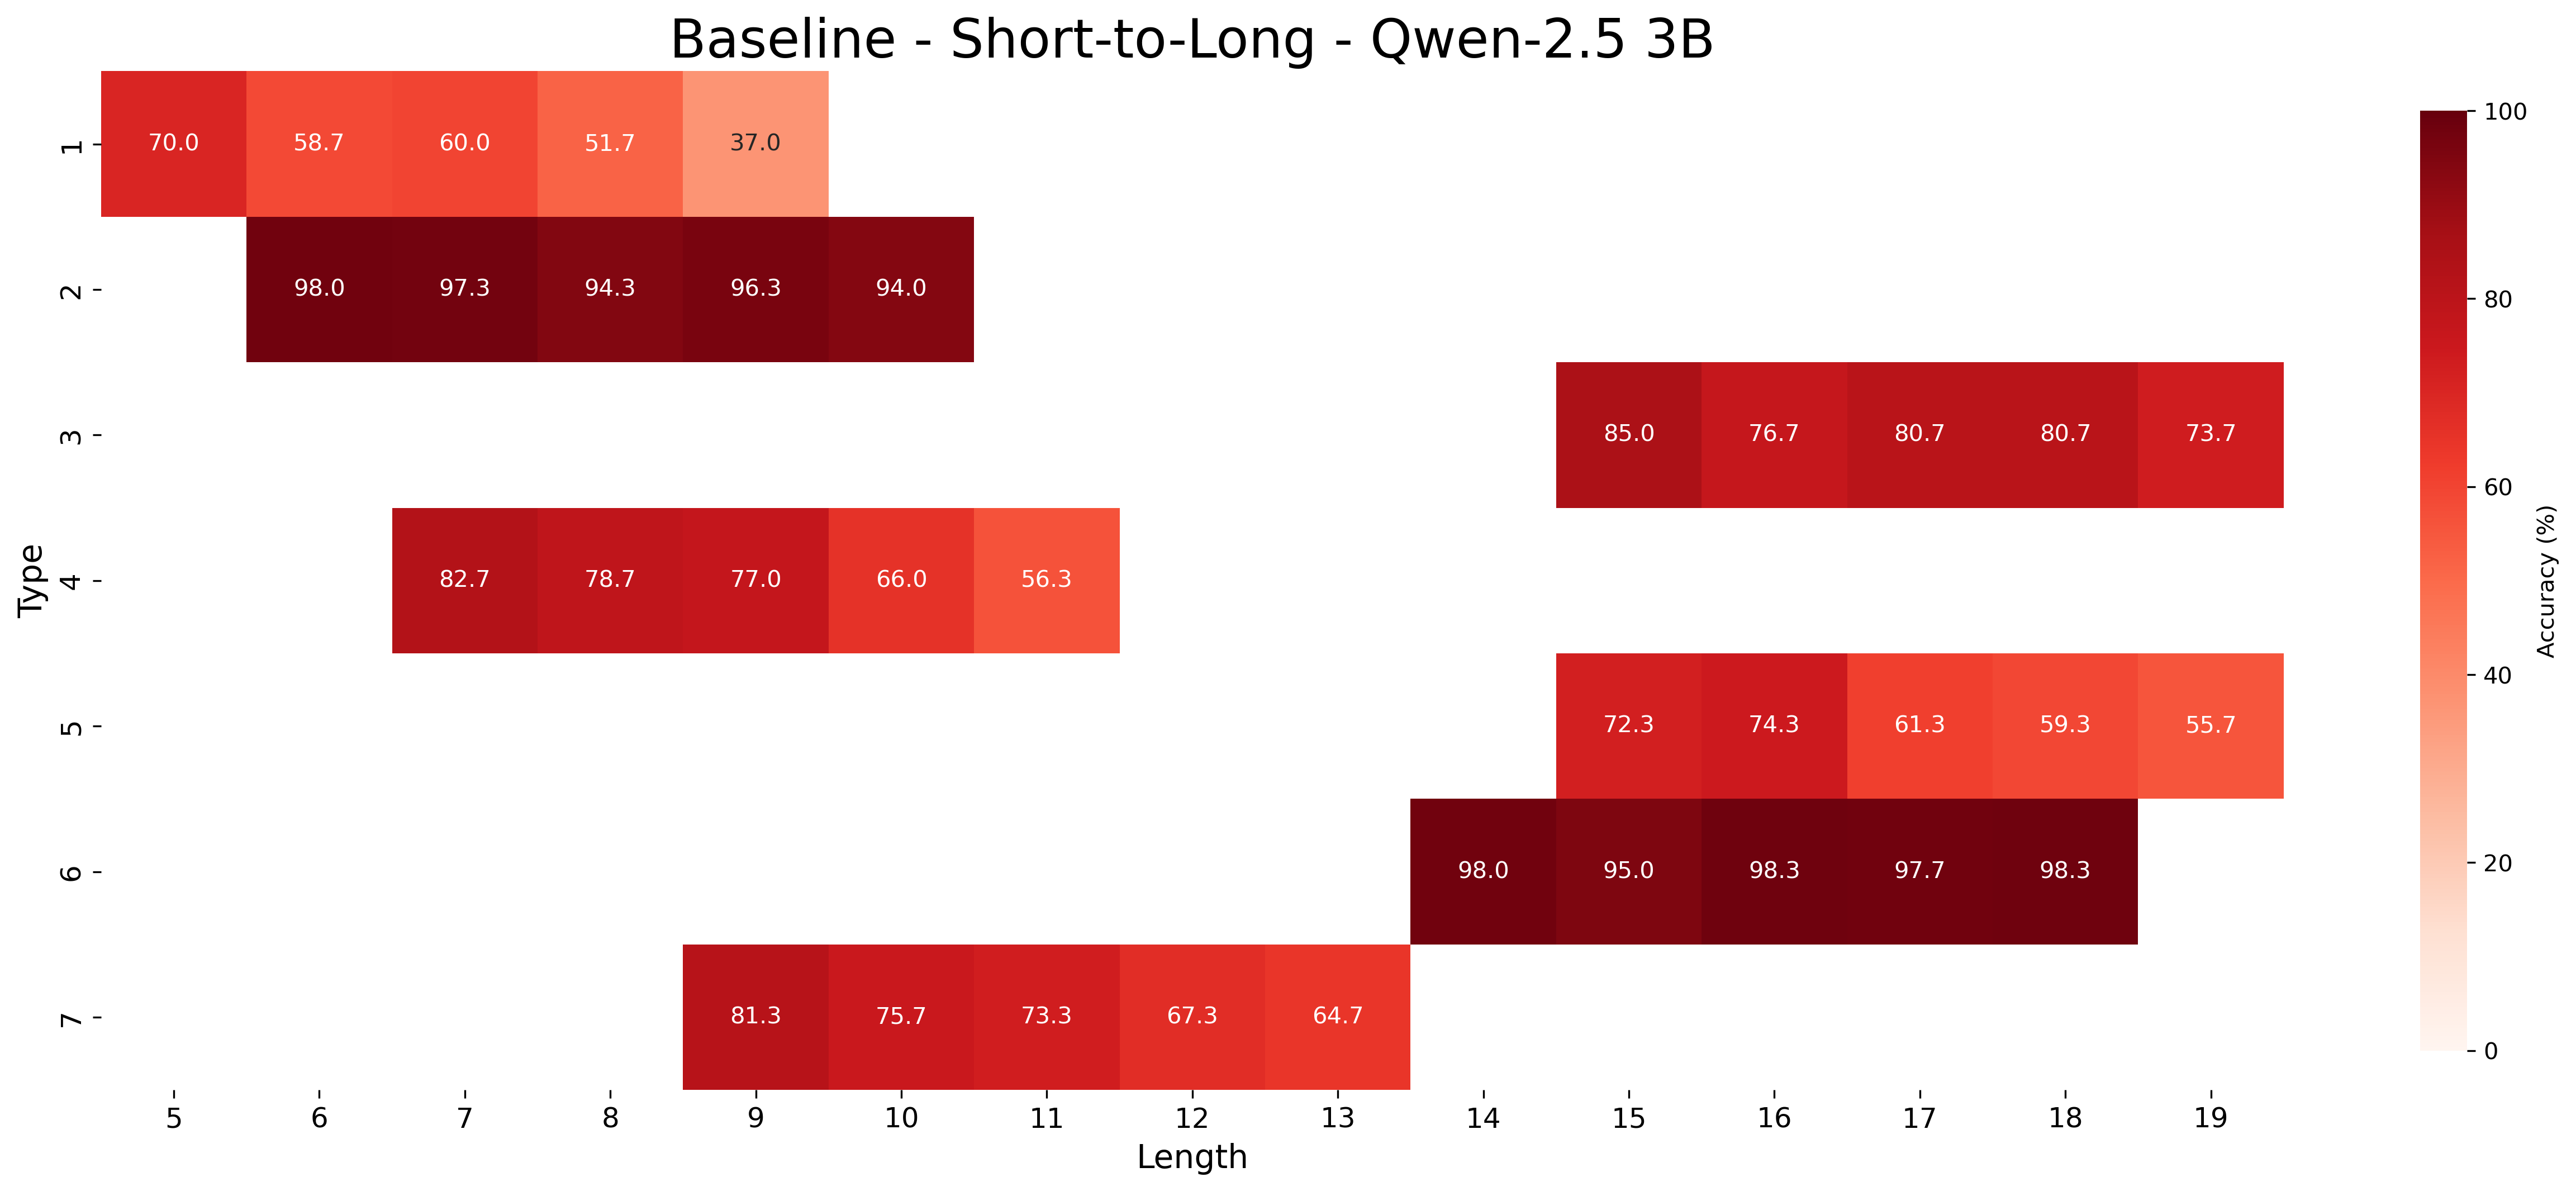
The image is a heatmap displaying accuracy percentages for different types of data across varying lengths. The heatmap uses a color gradient from white to dark red, where darker shades of red indicate higher accuracy. The y-axis represents "Type" (categories 1 through 7), and the x-axis represents "Length" (values 5 through 19).
### Components/Axes
* **Title:** Baseline - Short-to-Long - Qwen-2.5 3B
* **X-axis:** Length (numerical values from 5 to 19)
* **Y-axis:** Type (categorical values from 1 to 7)
* **Color Legend:** Located on the right side of the heatmap, showing a gradient from white (0%) to dark red (100%) representing "Accuracy (%)".
### Detailed Analysis
The heatmap presents accuracy values for each combination of "Type" and "Length". Each cell contains a numerical value representing the accuracy percentage.
* **Type 1:**
* Length 5: 70.0%
* Length 6: 58.7%
* Length 7: 60.0%
* Length 8: 51.7%
* Length 9: 37.0%
* **Type 2:**
* Length 6: 98.0%
* Length 7: 97.3%
* Length 8: 94.3%
* Length 9: 96.3%
* Length 10: 94.0%
* **Type 3:**
* Length 14: 85.0%
* Length 15: 76.7%
* Length 16: 80.7%
* Length 17: 80.7%
* Length 18: 73.7%
* **Type 4:**
* Length 9: 82.7%
* Length 10: 78.7%
* Length 11: 77.0%
* Length 12: 66.0%
* Length 13: 56.3%
* **Type 5:**
* Length 14: 72.3%
* Length 15: 74.3%
* Length 16: 61.3%
* Length 17: 59.3%
* Length 18: 55.7%
* **Type 6:**
* Length 14: 98.0%
* Length 15: 95.0%
* Length 16: 98.3%
* Length 17: 97.7%
* Length 18: 98.3%
* **Type 7:**
* Length 9: 81.3%
* Length 10: 75.7%
* Length 11: 73.3%
* Length 12: 67.3%
* Length 13: 64.7%
### Key Observations
* Types 2 and 6 generally exhibit higher accuracy compared to other types.
* Type 1 shows a decreasing trend in accuracy as the length increases from 5 to 9.
* Types 4 and 7 show a decreasing trend in accuracy as the length increases from 9 to 13.
* Type 5 shows a decreasing trend in accuracy as the length increases from 14 to 18.
* Type 3 shows a decreasing trend in accuracy as the length increases from 14 to 18.
### Interpretation
The heatmap visualizes the performance of a model (Qwen-2.5 3B) under "Short-to-Long" conditions. The "Type" likely represents different categories or classes of data, and "Length" could refer to the sequence length or input size. The accuracy values indicate how well the model performs for each combination of data type and length.
The data suggests that the model performs better on certain types of data (Types 2 and 6) regardless of the length. For other types (1, 4, 5, and 7), the accuracy tends to decrease as the length increases, indicating potential challenges in handling longer sequences for those specific data categories. Type 3 shows a similar decreasing trend.
The heatmap allows for a quick comparison of the model's performance across different data types and lengths, highlighting areas where the model excels and areas where further improvement may be needed.