## Heatmap: Baseline - Short-to-Long - Qwen-2.5 3B
### Overview
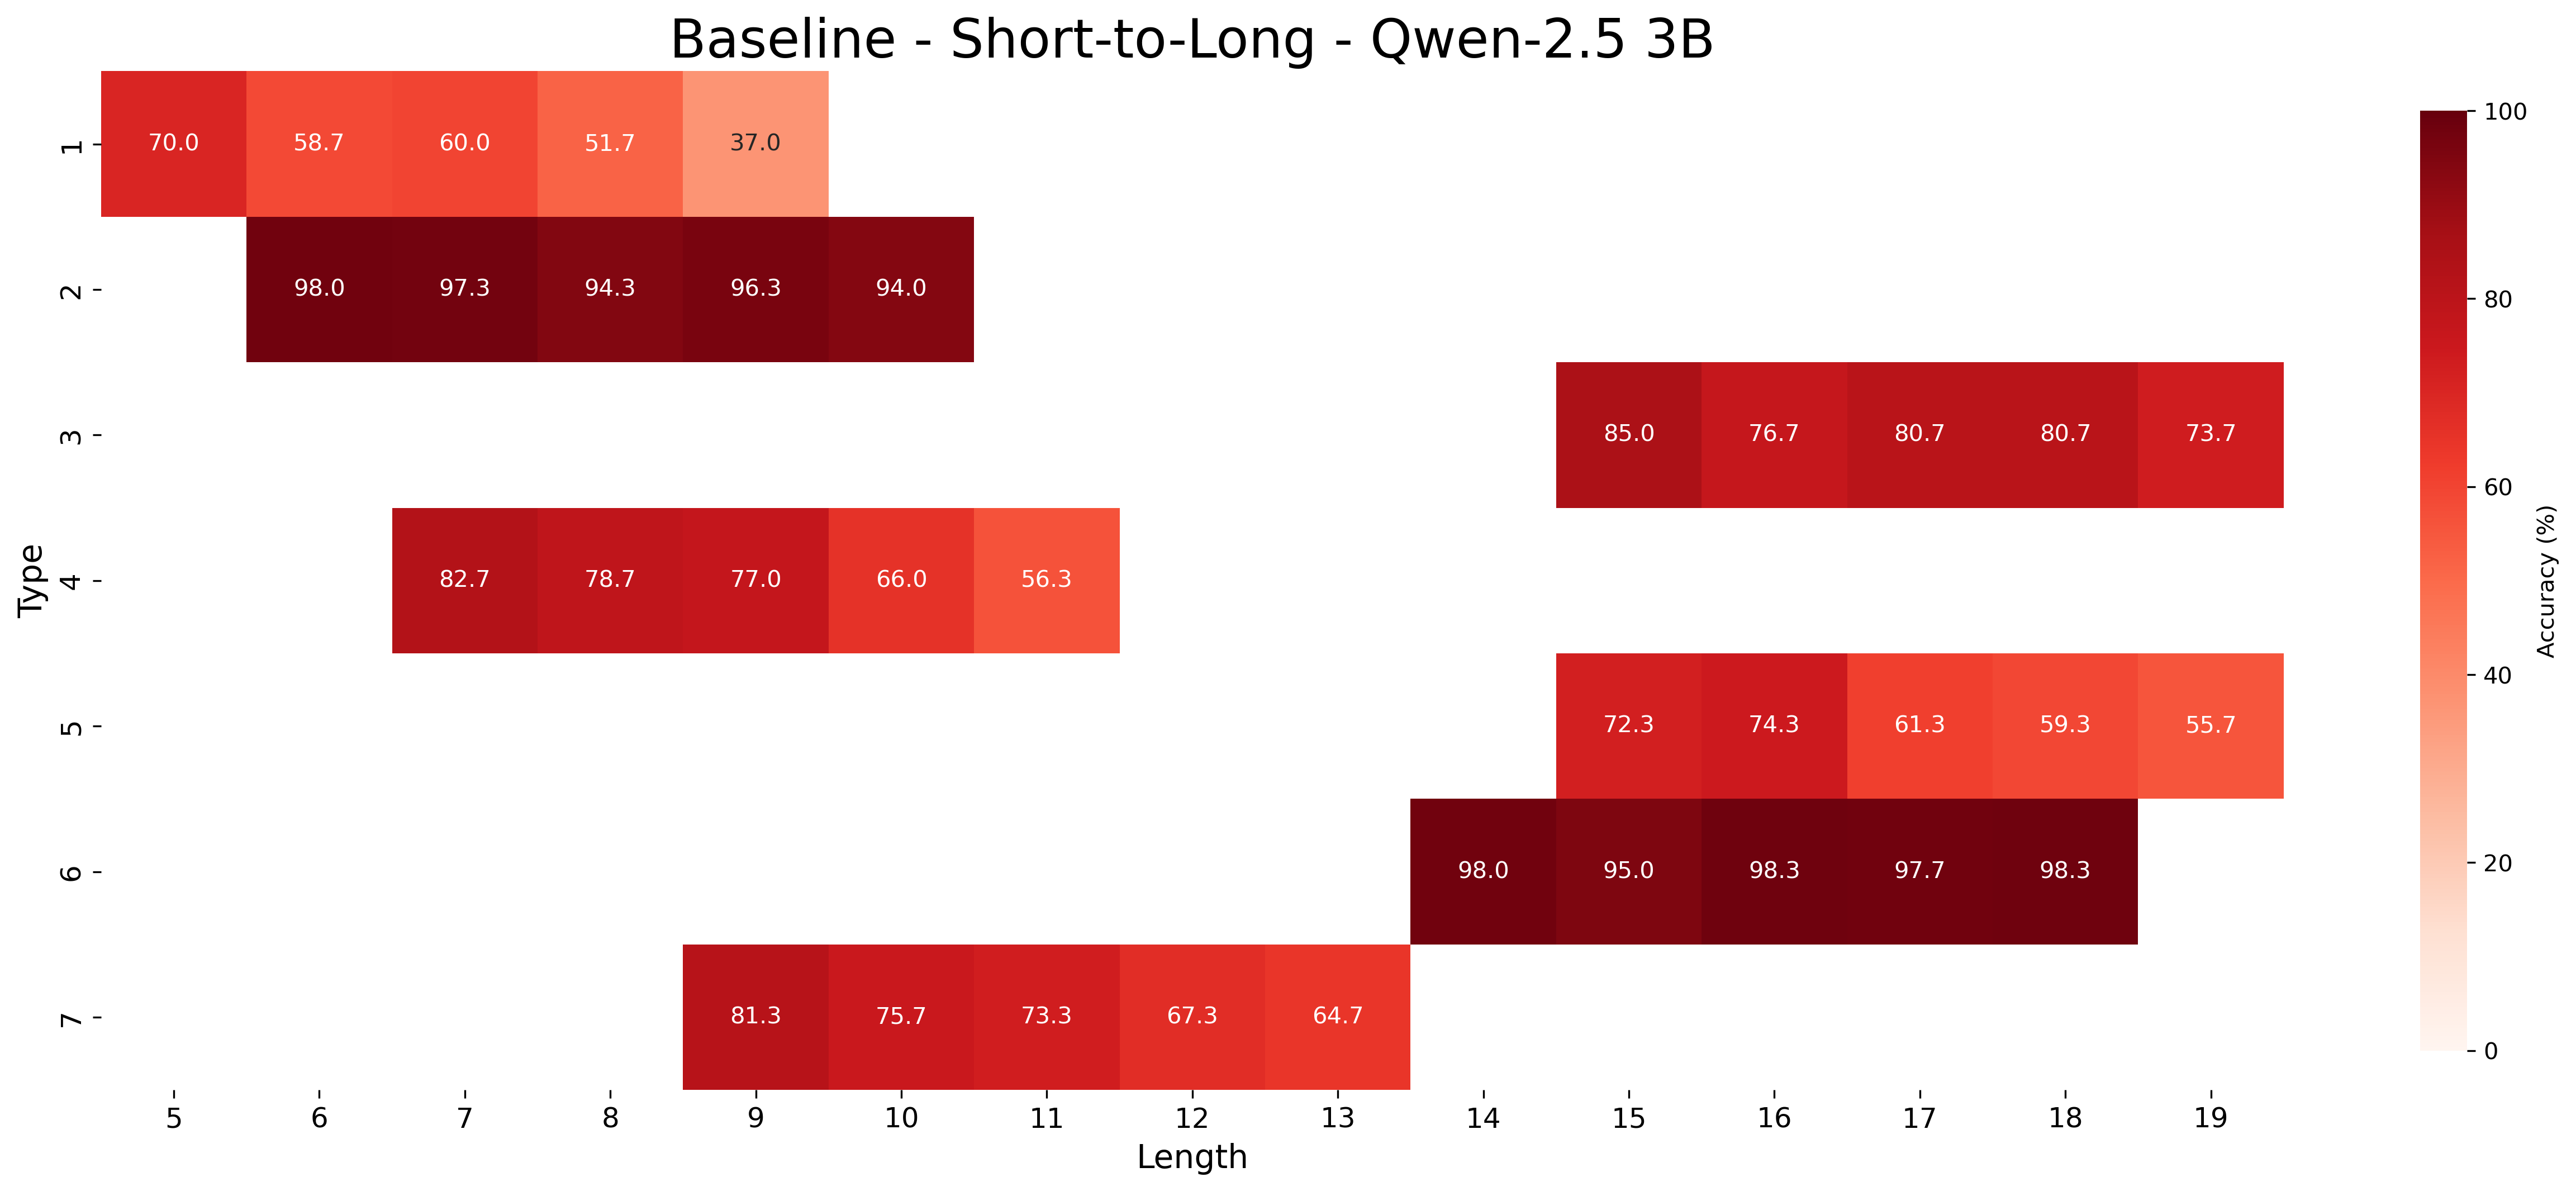
This image presents a heatmap visualizing the accuracy of a model (Qwen-2.5 3B) in a "Short-to-Long" task, categorized by "Type" and "Length". The heatmap uses a color gradient to represent accuracy values, ranging from approximately 37% to 98%.
### Components/Axes
* **Title:** Baseline - Short-to-Long - Qwen-2.5 3B (Top-center)
* **X-axis:** Length, ranging from 5 to 19, with markers at each integer value. (Bottom)
* **Y-axis:** Type, ranging from 1 to 7, with markers at each integer value. (Left)
* **Colorbar:** A vertical colorbar on the right side represents Accuracy (%), ranging from 0 to 100. The color gradient transitions from light yellow (low accuracy) to dark red (high accuracy).
### Detailed Analysis
The heatmap displays accuracy values for each combination of Type and Length. Here's a breakdown of the data, reading row by row (Type 1 to Type 7):
* **Type 1:** Accuracy decreases as Length increases.
* Length 5: 70.0%
* Length 6: 58.7%
* Length 7: 50.1%
* Length 8: 37.0%
* **Type 2:** Accuracy remains consistently high (above 94%) across all lengths.
* Length 5: 98.0%
* Length 6: 97.3%
* Length 7: 94.3%
* Length 8: 96.3%
* Length 9: 94.0%
* **Type 3:** Accuracy is high, with a slight decrease from Length 5 to Length 9.
* Length 5: 85.0%
* Length 6: 76.7%
* Length 7: 80.7%
* Length 8: 80.7%
* Length 9: 73.7%
* **Type 4:** Accuracy decreases as Length increases.
* Length 5: 82.7%
* Length 6: 78.7%
* Length 7: 77.0%
* Length 8: 66.0%
* Length 9: 56.3%
* **Type 5:** Accuracy decreases as Length increases.
* Length 10: 72.3%
* Length 11: 74.3%
* Length 12: 61.3%
* Length 13: 59.3%
* Length 14: 55.7%
* **Type 6:** Accuracy is very high and remains relatively stable across all lengths.
* Length 10: 98.0%
* Length 11: 95.0%
* Length 12: 97.7%
* Length 13: 98.3%
* **Type 7:** Accuracy decreases as Length increases.
* Length 10: 81.3%
* Length 11: 75.7%
* Length 12: 73.3%
* Length 13: 67.3%
* Length 14: 64.7%
### Key Observations
* **Type 2 and Type 6** consistently exhibit the highest accuracy across all lengths, suggesting the model performs exceptionally well on these types.
* **Type 1, Type 4, and Type 7** show a clear negative correlation between length and accuracy – as the length increases, the accuracy decreases.
* **Type 3 and Type 5** show a more complex relationship, with accuracy fluctuating as length increases.
* The heatmap reveals that the model's performance is highly dependent on both the "Type" and "Length" of the input.
### Interpretation
The heatmap demonstrates the performance of the Qwen-2.5 3B model on a "Short-to-Long" task, broken down by different types and lengths. The data suggests that the model is more accurate on certain types (2 and 6) than others (1, 4, and 7). The decreasing accuracy with increasing length for some types indicates a potential challenge in handling longer sequences. This could be due to limitations in the model's attention mechanism or its ability to capture long-range dependencies. The consistent high accuracy for Types 2 and 6 might indicate that these types are simpler or better aligned with the model's training data. Further investigation would be needed to understand the specific characteristics of each "Type" and why the model performs differently on them. The heatmap provides a valuable visual summary of the model's strengths and weaknesses, guiding future development and optimization efforts.