# Technical Document Extraction: Control Value Over Time
## Chart Description
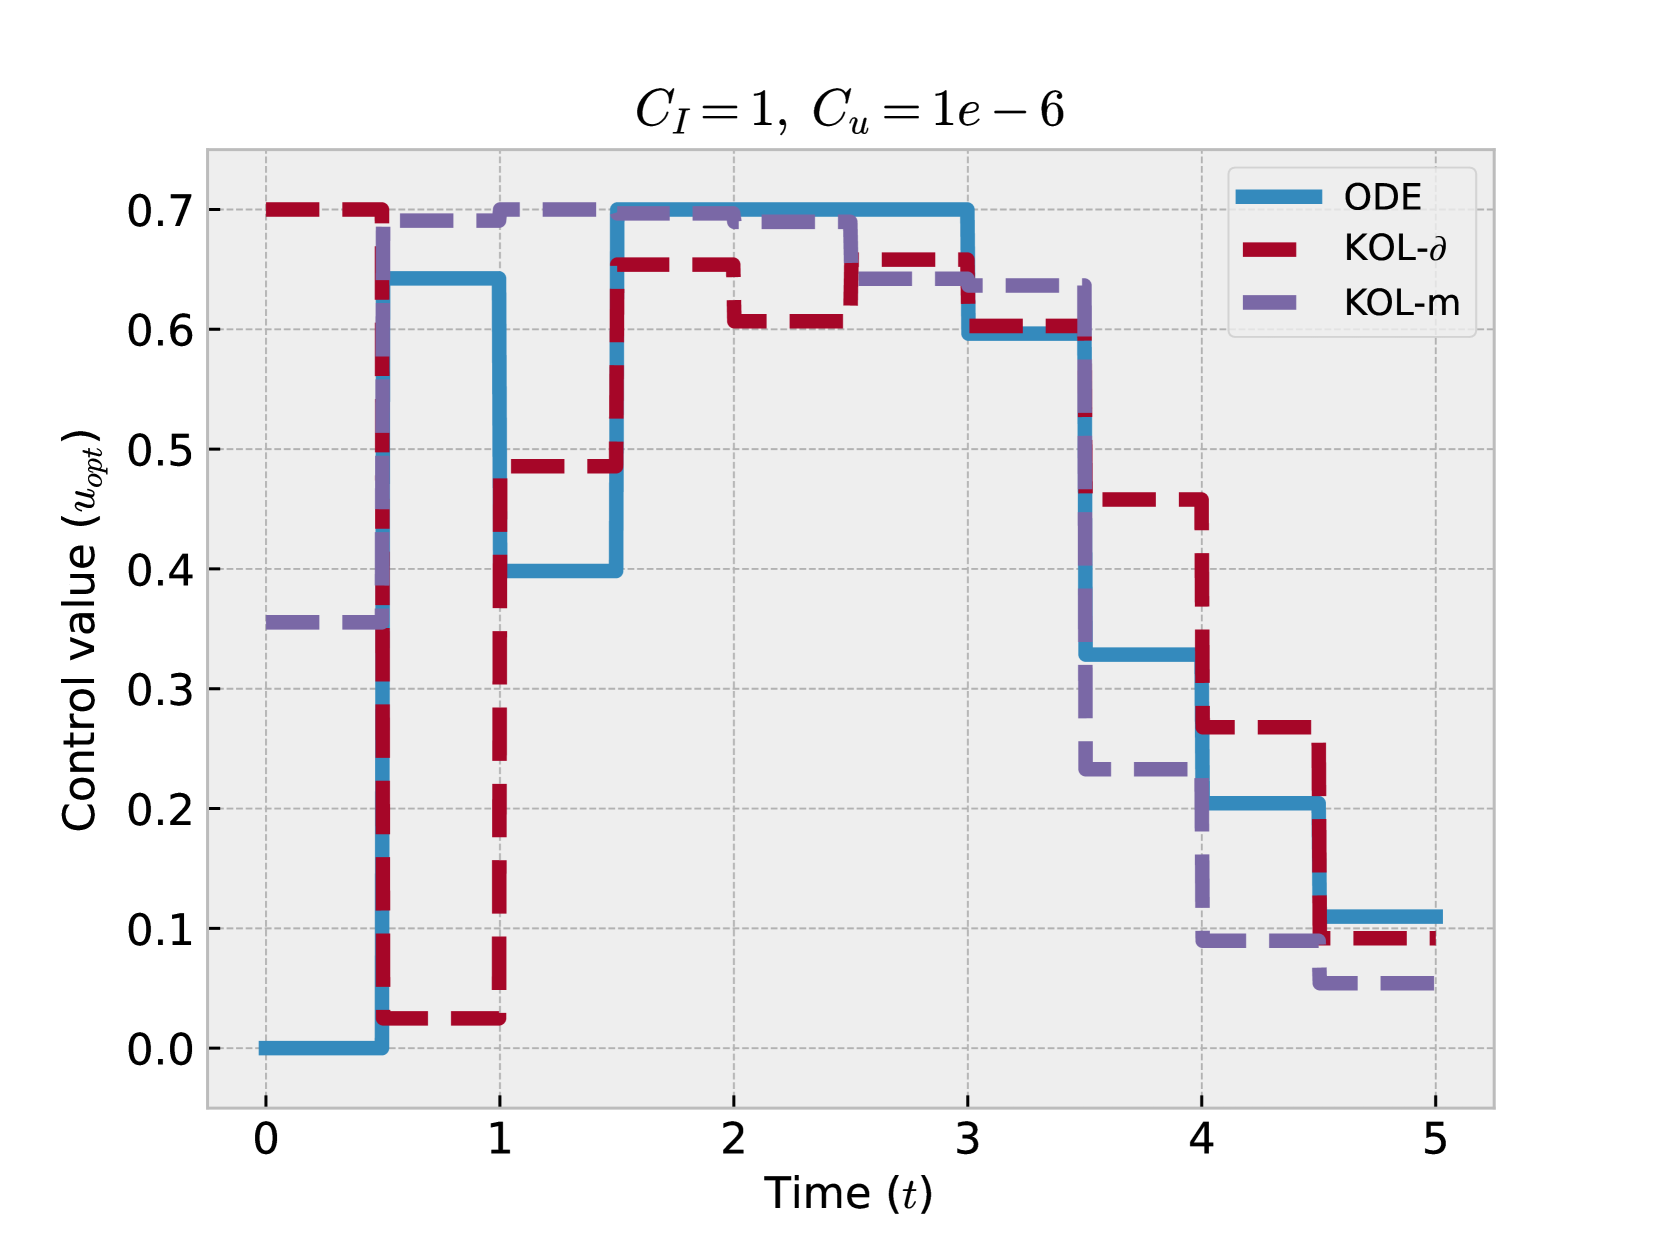
The image depicts a **stepwise line chart** illustrating the evolution of control values (`u_opt`) over time (`t`) for three distinct control strategies. The chart includes labeled axes, a legend, and embedded parameters.
---
### **Key Components**
1. **Title**:
`C_I = 1, C_u = 1e-6`
- Indicates system parameters:
- `C_I` (Integral gain) = 1
- `C_u` (Control coefficient) = 1 × 10⁻⁶
2. **Axes**:
- **X-axis (Time, `t`)**:
- Range: 0 to 5 (increments of 1).
- Labels: `0, 1, 2, 3, 4, 5`.
- **Y-axis (Control value, `u_opt`)**:
- Range: 0.0 to 0.7 (increments of 0.1).
- Labels: `0.0, 0.1, 0.2, 0.3, 0.4, 0.5, 0.6, 0.7`.
3. **Legend**:
- **ODE**: Blue solid line.
- **KOL-δ**: Red dashed line.
- **KOL-m**: Purple dash-dot line.
---
### **Data Trends**
#### **1. ODE (Blue Line)**
- **Initial State**: `u_opt = 0.0` at `t = 0`.
- **Step Changes**:
- Jumps to `0.7` at `t = 0.5`.
- Drops to `0.4` at `t = 1.5`.
- Rises to `0.7` at `t = 2.5`.
- Falls to `0.3` at `t = 3.5`.
- Increases to `0.6` at `t = 4.5`.
- Drops to `0.1` at `t = 5`.
#### **2. KOL-δ (Red Dashed Line)**
- **Initial State**: `u_opt = 0.7` at `t = 0`.
- **Step Changes**:
- Drops to `0.3` at `t = 0.5`.
- Remains at `0.3` until `t = 1.5`.
- Jumps to `0.6` at `t = 2.5`.
- Falls to `0.4` at `t = 3.5`.
- Rises to `0.5` at `t = 4.5`.
- Drops to `0.1` at `t = 5`.
#### **3. KOL-m (Purple Dash-Dot Line)**
- **Initial State**: `u_opt = 0.3` at `t = 0`.
- **Step Changes**:
- Rises to `0.7` at `t = 0.5`.
- Drops to `0.5` at `t = 1.5`.
- Remains at `0.5` until `t = 2.5`.
- Falls to `0.3` at `t = 3.5`.
- Increases to `0.4` at `t = 4.5`.
- Drops to `0.05` at `t = 5`.
---
### **Critical Observations**
1. **Control Value Dynamics**:
- All strategies exhibit stepwise behavior, suggesting discrete control adjustments.
- **ODE** shows the most frequent oscillations, while **KOL-m** has the largest initial jump.
- All strategies converge to `u_opt ≈ 0.1` by `t = 5`.
2. **Parameter Influence**:
- The parameters `C_I = 1` and `C_u = 1e-6` likely govern the sensitivity and scaling of control adjustments.
3. **Legend Consistency**:
- Colors and line styles in the legend match the corresponding lines in the chart.
---
### **Summary**
The chart compares three control strategies (`ODE`, `KOL-δ`, `KOL-m`) under fixed parameters (`C_I = 1`, `C_u = 1e-6`). Control values evolve stepwise over time, with all strategies stabilizing near `u_opt = 0.1` by `t = 5`. The **ODE** strategy exhibits the highest variability, while **KOL-m** shows the largest initial adjustment.