## Line Chart: MMLU-Pro vs RL Training Steps
### Overview
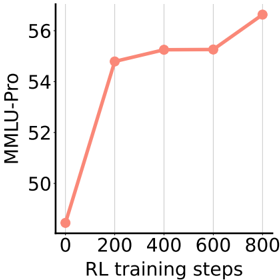
The image is a line chart showing the relationship between MMLU-Pro score and RL training steps. The x-axis represents RL training steps, and the y-axis represents the MMLU-Pro score. The chart shows an upward trend, indicating that the MMLU-Pro score generally increases with more RL training steps.
### Components/Axes
* **X-axis:** RL training steps, with markers at 0, 200, 400, 600, and 800.
* **Y-axis:** MMLU-Pro, with markers at 50, 52, 54, and 56.
* **Line:** A single line in light red color represents the data.
### Detailed Analysis
The line starts at approximately (0, 48.5) and increases rapidly to (200, 54.8). It then plateaus slightly, reaching (400, 55.2) and (600, 55.2) before increasing again to (800, 56.8).
* **RL training steps = 0:** MMLU-Pro ≈ 48.5
* **RL training steps = 200:** MMLU-Pro ≈ 54.8
* **RL training steps = 400:** MMLU-Pro ≈ 55.2
* **RL training steps = 600:** MMLU-Pro ≈ 55.2
* **RL training steps = 800:** MMLU-Pro ≈ 56.8
### Key Observations
* The most significant increase in MMLU-Pro score occurs between 0 and 200 RL training steps.
* The MMLU-Pro score plateaus between 400 and 600 RL training steps.
* The highest MMLU-Pro score is achieved at 800 RL training steps.
### Interpretation
The chart suggests that increasing RL training steps generally improves the MMLU-Pro score. However, the rate of improvement decreases as the number of training steps increases. The plateau between 400 and 600 steps indicates diminishing returns, suggesting that there may be an optimal number of training steps beyond which further training provides minimal benefit. The data demonstrates a positive correlation between RL training and MMLU-Pro performance, but also highlights the importance of considering the efficiency of training.