\n
## Heatmap: MIND - Core Generalization - Qwen-2.5 7B
### Overview
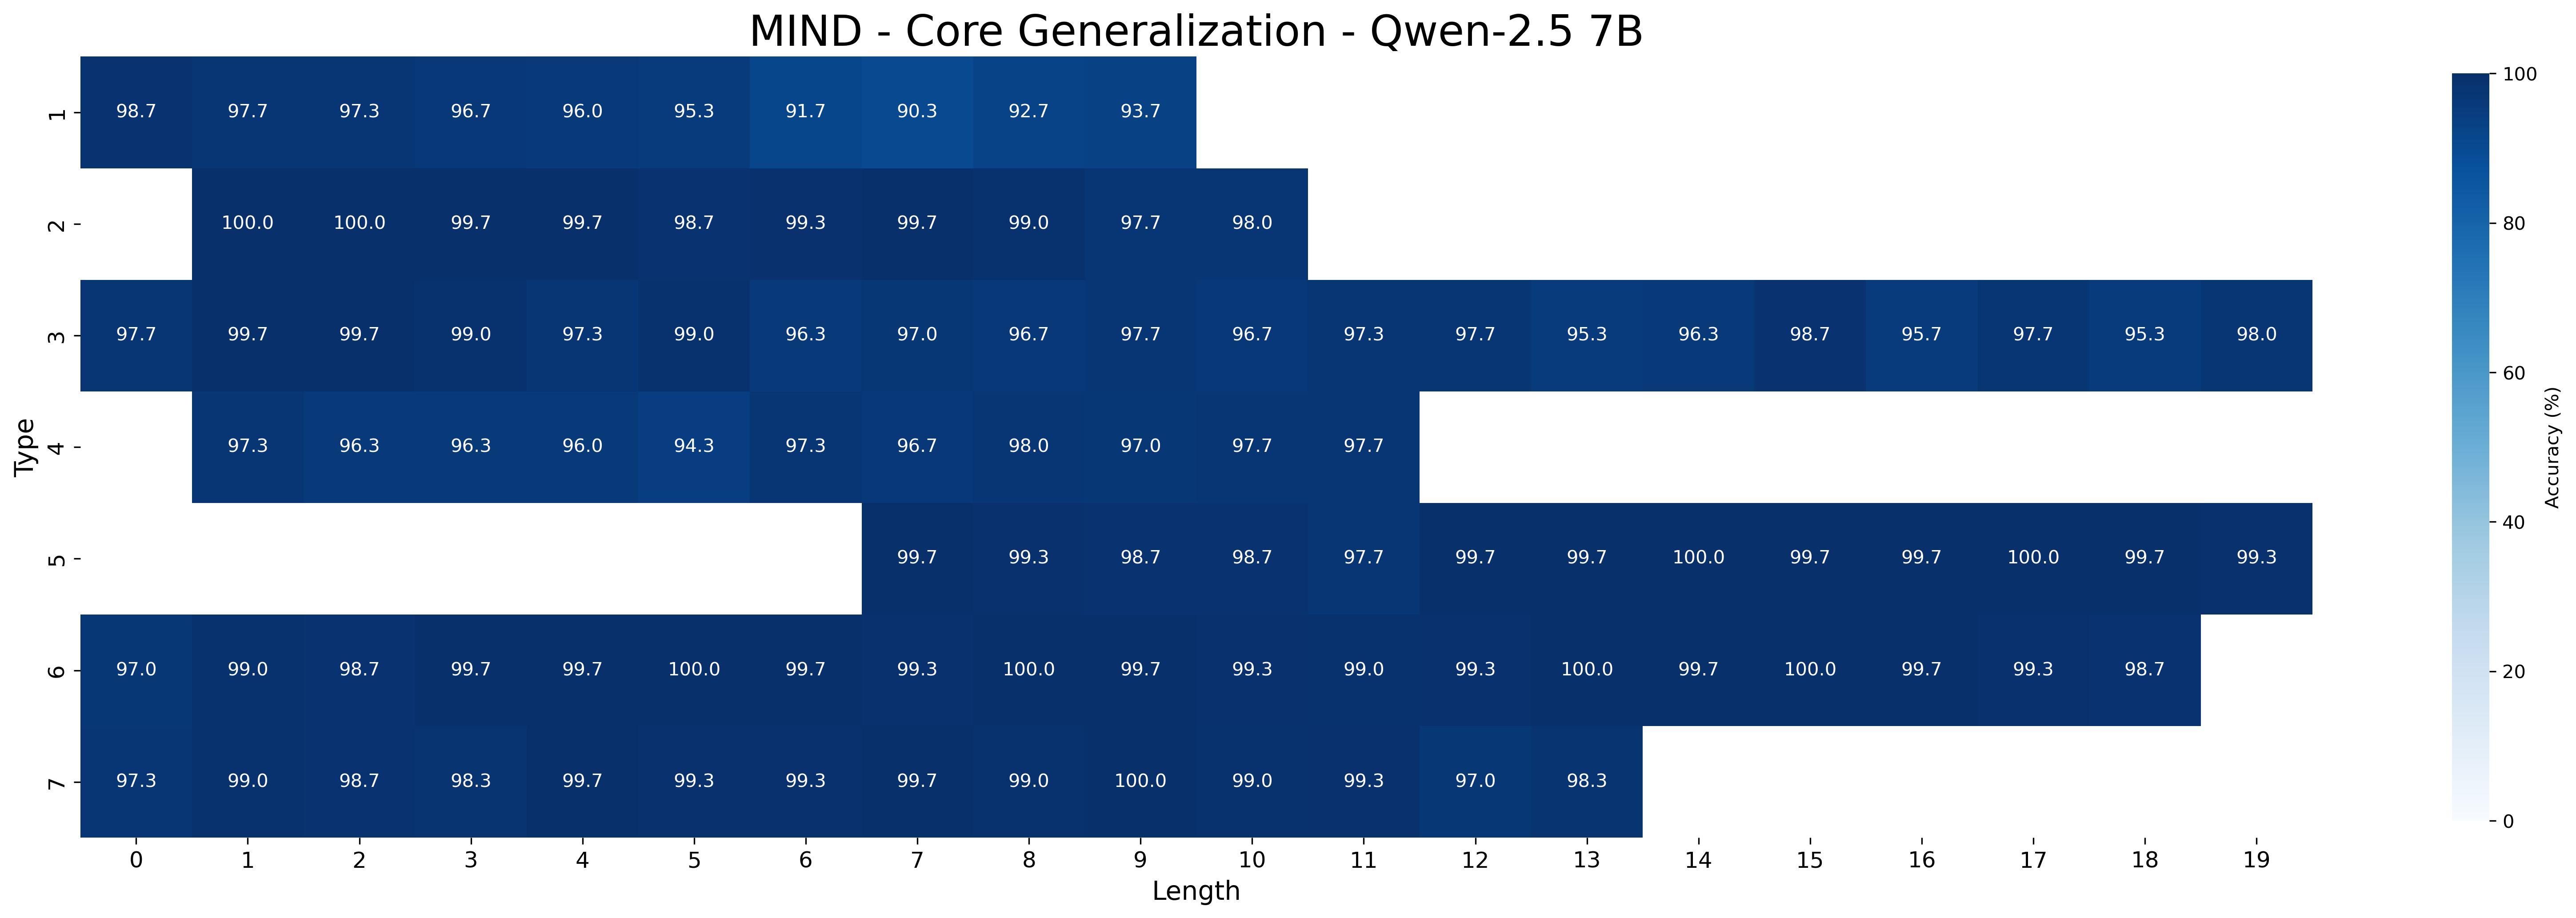
This image presents a heatmap visualizing the accuracy of the Qwen-2.5 7B model on the MIND dataset, specifically focusing on core generalization. The heatmap displays accuracy percentages based on two dimensions: 'Type' and 'Length'. The color gradient ranges from light blue (low accuracy) to dark blue (high accuracy).
### Components/Axes
* **Title:** MIND - Core Generalization - Qwen-2.5 7B (Top-center)
* **X-axis:** Length (ranging from 0 to 19, with integer increments).
* **Y-axis:** Type (with categories: 'r', '2', 'm', '4', 'u', 'o', '7').
* **Color Scale:** Accuracy (%) ranging from 0 to 100, displayed on the right side of the heatmap.
* **Data Points:** Each cell in the heatmap represents the accuracy percentage for a specific combination of 'Type' and 'Length'.
### Detailed Analysis
The heatmap shows accuracy values for each combination of 'Type' and 'Length'. Here's a breakdown of the data, reading row by row (Type 'r' to '7'):
* **Type 'r':**
* Length 0: 98.7%
* Length 1: 97.3%
* Length 2: 96.0%
* Length 3: 95.3%
* Length 4: 91.7%
* Length 5: 90.3%
* Length 6: 92.7%
* Length 7: 93.7%
* **Type '2':**
* Length 0: 100.0%
* Length 1: 100.0%
* Length 2: 99.7%
* Length 3: 98.7%
* Length 4: 99.0%
* Length 5: 99.0%
* Length 6: 97.0%
* Length 7: 98.0%
* **Type 'm':**
* Length 0: 99.7%
* Length 1: 99.9%
* Length 2: 99.0%
* Length 3: 99.0%
* Length 4: 96.3%
* Length 5: 96.7%
* Length 6: 97.7%
* Length 7: 97.3%
* Length 8: 95.3%
* Length 9: 96.0%
* **Type '4':**
* Length 0: 97.3%
* Length 1: 96.3%
* Length 2: 96.0%
* Length 3: 94.3%
* Length 4: 96.7%
* Length 5: 98.0%
* Length 6: 97.0%
* Length 7: 97.7%
* **Type 'u':**
* Length 5: 99.7%
* Length 6: 99.3%
* Length 7: 98.7%
* Length 8: 97.7%
* Length 9: 99.7%
* Length 10: 100.0%
* Length 11: 100.0%
* Length 12: 99.7%
* Length 13: 99.3%
* **Type 'o':**
* Length 0: 97.0%
* Length 1: 99.0%
* Length 2: 98.7%
* Length 3: 99.7%
* Length 4: 100.0%
* Length 5: 99.7%
* Length 6: 99.3%
* Length 7: 99.0%
* Length 8: 100.0%
* Length 9: 99.7%
* Length 10: 99.7%
* Length 11: 99.3%
* Length 12: 98.7%
* **Type '7':**
* Length 0: 97.3%
* Length 1: 98.3%
* Length 2: 98.7%
* Length 3: 99.3%
* Length 4: 99.7%
* Length 5: 99.0%
* Length 6: 99.0%
* Length 7: 99.3%
* Length 8: 97.0%
### Key Observations
* Generally, accuracy is high across all 'Type' and 'Length' combinations, mostly above 95%.
* Type '2' consistently shows very high accuracy (close to 100%) for lengths 0-7.
* Type 'm' also exhibits high accuracy, with a slight dip around length 5-6.
* Type 'u' and 'o' show consistently high accuracy for lengths 5 and above.
* Type 'r' shows a decreasing trend in accuracy as length increases from 0 to 4, then stabilizes.
* Type '4' shows a similar trend to 'r', with a slight decrease in accuracy as length increases.
### Interpretation
The heatmap demonstrates the strong performance of the Qwen-2.5 7B model on the MIND dataset for core generalization. The high accuracy scores across most 'Type' and 'Length' combinations suggest the model is robust and can effectively handle different input characteristics. The variations in accuracy based on 'Type' and 'Length' indicate that the model may be more sensitive to certain input patterns or lengths. For example, the consistently high accuracy for Type '2' suggests the model excels at processing inputs of that specific type. The slight dips in accuracy for Type 'm' and 'r' at certain lengths might indicate areas where the model could benefit from further training or optimization. Overall, the heatmap provides a valuable visual representation of the model's strengths and weaknesses, aiding in targeted improvements and a deeper understanding of its generalization capabilities.