## Heatmap: MIND - Core Generalization - Qwen-2.5 7B
### Overview
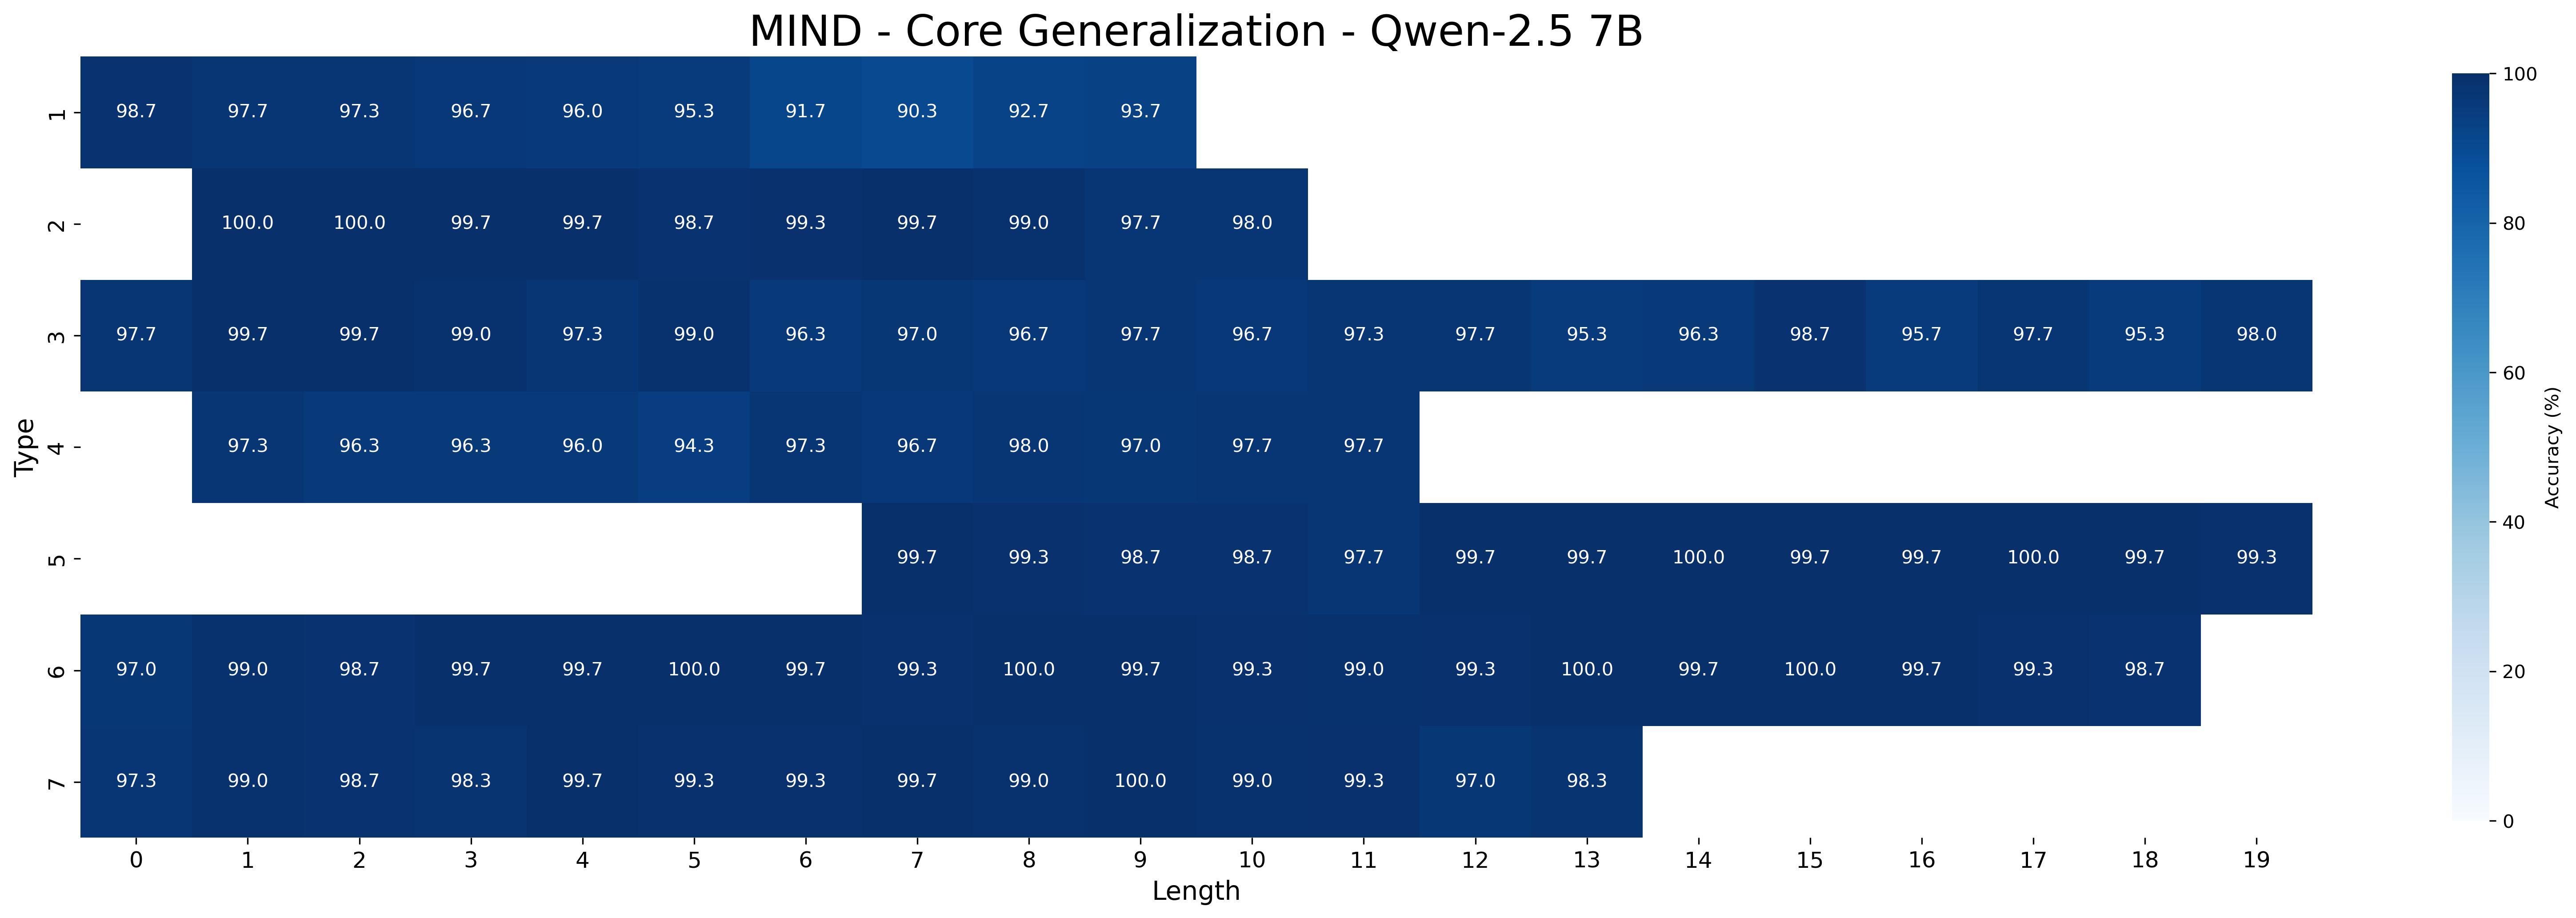
This image is a heatmap visualizing the accuracy percentages of a model named "Qwen-2.5 7B" on a task or benchmark called "MIND - Core Generalization." The heatmap plots performance across two dimensions: "Type" (y-axis) and "Length" (x-axis). The color intensity represents accuracy, with a scale from 0% (lightest) to 100% (darkest blue). Numerical accuracy values are overlaid on each colored cell.
### Components/Axes
* **Title:** "MIND - Core Generalization - Qwen-2.5 7B" (centered at the top).
* **Y-Axis (Vertical):** Labeled "Type." It contains 7 discrete categories, numbered 1 through 7 from top to bottom.
* **X-Axis (Horizontal):** Labeled "Length." It contains 20 discrete categories, numbered 0 through 19 from left to right.
* **Color Bar/Legend:** Located on the far right. It is a vertical gradient bar labeled "Accuracy (%)" with tick marks at 0, 20, 40, 60, 80, and 100. The gradient runs from white (0%) to dark blue (100%).
* **Data Cells:** The main grid consists of cells at the intersection of each Type and Length. Each cell is colored according to its accuracy value and contains the numerical percentage (e.g., "98.7"). Some cells are empty (white), indicating missing data or a value of 0%.
### Detailed Analysis
The following table reconstructs the data from the heatmap. "N/A" indicates an empty cell with no numerical value.
| Type \ Length | 0 | 1 | 2 | 3 | 4 | 5 | 6 | 7 | 8 | 9 | 10 | 11 | 12 | 13 | 14 | 15 | 16 | 17 | 18 | 19 |
| :--- | :--- | :--- | :--- | :--- | :--- | :--- | :--- | :--- | :--- | :--- | :--- | :--- | :--- | :--- | :--- | :--- | :--- | :--- | :--- | :--- |
| **1** | 98.7 | 97.7 | 97.3 | 96.7 | 96.0 | 95.3 | 91.7 | 90.3 | 92.7 | 93.7 | N/A | N/A | N/A | N/A | N/A | N/A | N/A | N/A | N/A | N/A |
| **2** | N/A | 100.0 | 100.0 | 99.7 | 99.7 | 98.7 | 99.3 | 99.7 | 99.0 | 97.7 | 98.0 | N/A | N/A | N/A | N/A | N/A | N/A | N/A | N/A | N/A |
| **3** | 97.7 | 99.7 | 99.7 | 99.0 | 97.3 | 99.0 | 96.3 | 97.0 | 96.7 | 97.7 | 96.7 | 97.3 | 97.7 | 95.3 | 96.3 | 98.7 | 95.7 | 97.7 | 95.3 | 98.0 |
| **4** | N/A | 97.3 | 96.3 | 96.3 | 96.0 | 94.3 | 97.3 | 96.7 | 98.0 | 97.0 | 97.7 | 97.7 | N/A | N/A | N/A | N/A | N/A | N/A | N/A | N/A |
| **5** | N/A | N/A | N/A | N/A | N/A | N/A | N/A | 99.7 | 99.3 | 98.7 | 98.7 | 97.7 | 99.7 | 99.7 | 100.0 | 99.7 | 99.7 | 100.0 | 99.7 | 99.3 |
| **6** | 97.0 | 99.0 | 98.7 | 99.7 | 99.7 | 100.0 | 99.7 | 99.3 | 100.0 | 99.7 | 99.3 | 99.0 | 99.3 | 100.0 | 99.7 | 100.0 | 99.7 | 99.3 | 98.7 | N/A |
| **7** | 97.3 | 99.0 | 98.7 | 98.3 | 99.7 | 99.3 | 99.3 | 99.7 | 99.0 | 100.0 | 99.0 | 99.3 | 97.0 | 98.3 | N/A | N/A | N/A | N/A | N/A | N/A |
**Trend Verification per Type:**
* **Type 1:** Shows a general downward trend in accuracy as Length increases from 0 to 7, dropping from 98.7% to 90.3%, before a slight recovery at Lengths 8 and 9.
* **Type 2:** Maintains very high accuracy (97.7% - 100.0%) across its available Lengths (1-10), with no strong directional trend.
* **Type 3:** Exhibits consistently high accuracy (95.3% - 99.7%) across all Lengths (0-19), with minor fluctuations but no significant drop-off.
* **Type 4:** Shows stable, high accuracy (94.3% - 98.0%) across its available Lengths (1-11).
* **Type 5:** Has data only for longer Lengths (7-19) and demonstrates exceptionally high and stable accuracy (97.7% - 100.0%).
* **Type 6:** Shows consistently high accuracy (97.0% - 100.0%) across its available Lengths (0-18).
* **Type 7:** Maintains high accuracy (97.0% - 100.0%) across its available Lengths (0-13).
### Key Observations
1. **High Overall Performance:** The vast majority of data points show accuracy above 95%, indicating strong performance of the Qwen-2.5 7B model on this "Core Generalization" task.
2. **Data Sparsity Pattern:** The heatmap is not fully populated. Data is missing in a structured way:
* **Type 1:** Missing data for Lengths 10-19.
* **Type 2:** Missing data for Length 0 and Lengths 11-19.
* **Type 4:** Missing data for Length 0 and Lengths 12-19.
* **Type 5:** Missing data for Lengths 0-6.
* **Type 6:** Missing data for Length 19.
* **Type 7:** Missing data for Lengths 14-19.
* Only **Type 3** has complete data across all Lengths (0-19).
3. **Performance Dips:** The most notable performance dip is in **Type 1**, where accuracy falls to 90.3% at Length 7. Other minor dips include Type 4 at Length 5 (94.3%) and Type 3 at various points (e.g., 95.3% at Lengths 13 and 18).
4. **Perfect Scores:** Several cells achieve 100.0% accuracy: Type 2 (Lengths 1, 2), Type 5 (Lengths 14, 17), and Type 6 (Lengths 5, 8, 13, 15).
### Interpretation
This heatmap provides a granular view of a model's generalization capability. The "Type" axis likely represents different categories, tasks, or problem formats within the "MIND" benchmark, while "Length" probably corresponds to sequence length, problem complexity, or number of reasoning steps.
The data suggests that the Qwen-2.5 7B model generalizes very well across most types and lengths, as evidenced by the predominantly dark blue cells and high numerical values. The model's performance is robust, with only one significant dip observed (Type 1, Length 7).
The structured missing data is intriguing. It may indicate that certain combinations of Type and Length were not part of the test set, or that the model was not evaluated on them. The fact that only Type 3 has a full evaluation across all lengths suggests it might be a primary or baseline category for this benchmark.
The presence of perfect 100% scores, especially in Type 5 and Type 6 at longer lengths, demonstrates that the model can achieve flawless performance on specific, potentially more complex, instances of the task. The overall pattern implies that the model's core generalization abilities are strong, with performance remaining stable or only slightly degrading as the "Length" parameter increases, which is a desirable trait for handling complex or extended problems.