\n
## Diagram: Autonomous Vehicle System Workflow
### Overview
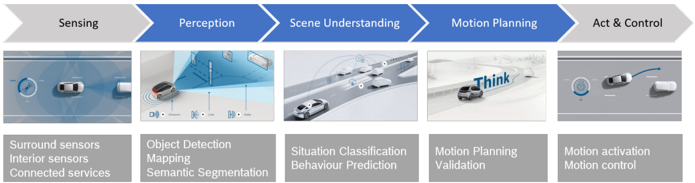
The image depicts a diagram illustrating the workflow of an autonomous vehicle system, broken down into five sequential stages: Sensing, Perception, Scene Understanding, Motion Planning, and Act & Control. Each stage is visually represented with an image and a corresponding text description of the processes involved. The diagram uses a horizontal flow, indicated by blue arrows connecting the stages.
### Components/Axes
The diagram consists of five main sections, each representing a stage in the autonomous driving process. Each section contains:
* **Stage Title:** Located in a blue banner at the top. The titles are: Sensing, Perception, Scene Understanding, Motion Planning, and Act & Control.
* **Visual Representation:** An image depicting the stage's function.
* **Text Description:** A list of processes occurring within that stage, positioned below the image.
### Detailed Analysis or Content Details
Here's a breakdown of each stage and its associated details:
1. **Sensing:**
* Image: Shows a vehicle surrounded by radiating blue circles, suggesting sensor coverage.
* Text: "Surround Sensors", "Interior sensors", "Connected services"
2. **Perception:**
* Image: Shows a vehicle with overlaid grid lines and highlighted objects, indicating object detection and mapping.
* Text: "Object Detection", "Mapping", "Semantic Segmentation"
3. **Scene Understanding:**
* Image: Shows a highway scene with multiple vehicles and overlaid data points, suggesting situation classification and behavior prediction.
* Text: "Situation Classification", "Behaviour Prediction"
4. **Motion Planning:**
* Image: Shows a vehicle on a road with a "Think" bubble above it, indicating planning and validation.
* Text: "Motion Planning", "Validation"
5. **Act & Control:**
* Image: Shows a vehicle executing a maneuver, with radiating blue circles similar to the Sensing stage.
* Text: "Motion activation", "Motion control"
### Key Observations
The diagram emphasizes a sequential, pipeline-like process for autonomous driving. Each stage builds upon the output of the previous one. The use of visual cues (radiating circles, grid lines, data points) effectively communicates the type of data processing occurring in each stage. The "Think" bubble in the Motion Planning stage is a notable visual element, highlighting the cognitive aspect of autonomous driving.
### Interpretation
This diagram illustrates a simplified model of how an autonomous vehicle operates. It highlights the key functional blocks required for self-driving capability. The flow from Sensing to Act & Control represents the core loop of perception, decision-making, and action. The diagram suggests that the system relies on a layered approach, starting with raw sensor data, progressing through interpretation and planning, and finally culminating in vehicle control. The inclusion of "Connected Services" in the Sensing stage indicates the potential for cloud-based data and assistance in the autonomous driving process. The diagram does not provide quantitative data or performance metrics, but rather serves as a conceptual overview of the system architecture. It is a high-level representation and does not delve into the complexities of algorithms or specific technologies used within each stage.