## Process Diagram: Autonomous Vehicle Processing Pipeline
### Overview
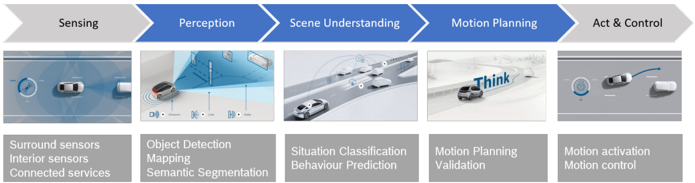
The image is a technical process diagram illustrating the sequential stages of an autonomous vehicle's decision-making and control system. It depicts a linear, five-stage pipeline from left to right, with each stage represented by a blue arrow header, a conceptual illustration, and a list of specific technical functions or components.
### Components/Axes
The diagram is structured into five vertical columns, each corresponding to a major processing stage. The stages are labeled in white text within blue, right-pointing chevron arrows at the top of the image.
**Stage Headers (Top Row, Left to Right):**
1. **Sensing**
2. **Perception**
3. **Scene Understanding**
4. **Motion Planning**
5. **Act & Control**
Below each header is a representative illustration and a gray box containing a list of sub-components or functions.
### Detailed Analysis
**Stage 1: Sensing**
* **Illustration:** A top-down view of a white car. Icons representing a camera, radar waves, and a LiDAR point cloud surround it.
* **Components (Gray Box):**
* Surround sensors
* Interior sensors
* Connected services
**Stage 2: Perception**
* **Illustration:** A white car emitting blue sensor beams (depicting field of view) towards a simplified road environment with a traffic light and another vehicle.
* **Components (Gray Box):**
* Object Detection
* Mapping
* Semantic Segmentation
**Stage 3: Scene Understanding**
* **Illustration:** A more complex road scene with multiple white cars, lane markings, and a curved arrow indicating a predicted path or interaction.
* **Components (Gray Box):**
* Situation Classification
* Behaviour Prediction
**Stage 4: Motion Planning**
* **Illustration:** A white car on a road with the word "Think" in blue text above it, symbolizing the planning computation.
* **Components (Gray Box):**
* Motion Planning
* Validation
**Stage 5: Act & Control**
* **Illustration:** A white car with a blue steering wheel icon and a curved blue arrow indicating a planned maneuver or trajectory.
* **Components (Gray Box):**
* Motion activation
* Motion control
### Key Observations
1. **Clear Segmentation:** The pipeline is cleanly divided into distinct, sequential functional domains, moving from raw data acquisition to physical vehicle actuation.
2. **Increasing Abstraction:** The illustrations progress from simple sensor icons (Sensing) to complex multi-agent traffic scenes (Scene Understanding), reflecting the increasing level of data abstraction and interpretation.
3. **Feedback Loop Implication:** While drawn linearly, the "Validation" step in Motion Planning and the nature of control systems imply an underlying feedback loop where outcomes inform future sensing and planning.
4. **Component Hierarchy:** Each major stage is broken down into specific, well-defined technical tasks (e.g., "Semantic Segmentation" under Perception).
### Interpretation
This diagram outlines the fundamental architecture of a self-driving system. It demonstrates a classic robotics "sense-plan-act" cycle, expanded and refined for the complex domain of autonomous driving.
* **Data Flow:** The flow is strictly left-to-right: raw sensor data (Sensing) is processed into environmental models (Perception), which are then interpreted to understand context and predict future states (Scene Understanding). This understanding informs the generation of a safe trajectory (Motion Planning), which is finally executed by the vehicle's hardware (Act & Control).
* **System Relationships:** The diagram emphasizes that each stage is dependent on the output of the previous one. Errors or limitations in early stages (e.g., poor object detection in Perception) will propagate and degrade the performance of all subsequent stages.
* **Notable Emphasis:** The inclusion of "Connected services" under Sensing highlights the importance of vehicle-to-everything (V2X) communication as a data source beyond onboard sensors. The separation of "Motion Planning" and "Validation" underscores the critical need for safety checks before any action is executed.
* **Purpose:** The diagram serves as a high-level educational or architectural overview, abstracting away immense computational complexity to show the logical sequence of operations required for a vehicle to perceive its environment and navigate through it autonomously.