## Line Chart: Model Performance Comparison
### Overview
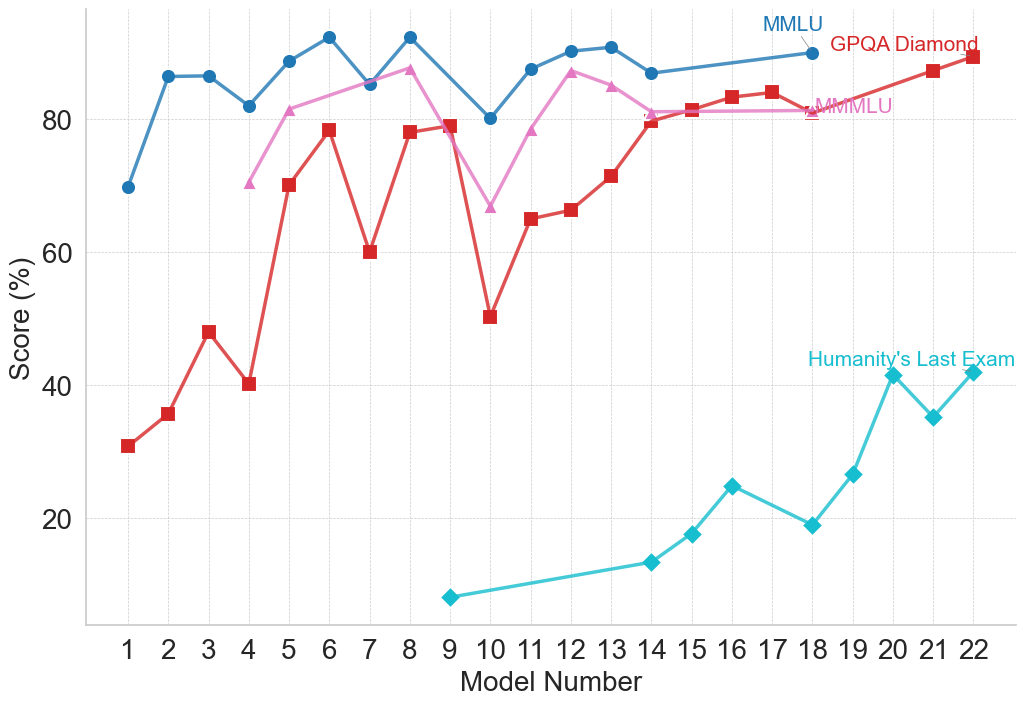
The image is a line chart comparing the performance of different models on various benchmarks. The chart displays the "Score (%)" on the y-axis against the "Model Number" on the x-axis. Four different models are represented by different colored lines: MMLU (blue), GPQA Diamond (red), AMMLU (pink), and Humanity's Last Exam (cyan).
### Components/Axes
* **X-axis:** "Model Number" ranging from 1 to 22.
* **Y-axis:** "Score (%)" ranging from 20 to 80, with implied values extending to 0 and 100.
* **Legend:** Located in the top-right corner, associating colors with model names:
* Blue: MMLU
* Red: GPQA Diamond
* Pink: AMMLU
* Cyan: Humanity's Last Exam
### Detailed Analysis
* **MMLU (Blue):**
* Trend: Generally high and relatively stable, with some fluctuations.
* Data Points:
* Model 1: ~70%
* Model 2: ~86%
* Model 3: ~86%
* Model 4: ~82%
* Model 5: ~87%
* Model 6: ~88%
* Model 7: ~91%
* Model 8: ~89%
* Model 9: ~87%
* Model 10: ~80%
* Model 11: ~87%
* Model 12: ~88%
* Model 13: ~89%
* Model 14: ~88%
* Model 15: ~86%
* Model 16: ~85%
* Model 17: ~84%
* Model 18: ~84%
* Model 19: ~84%
* Model 20: ~85%
* Model 21: ~85%
* Model 22: ~86%
* **GPQA Diamond (Red):**
* Trend: Starts low, increases sharply, fluctuates, and then stabilizes at a high level.
* Data Points:
* Model 1: ~31%
* Model 2: ~36%
* Model 3: ~49%
* Model 4: ~40%
* Model 5: ~72%
* Model 6: ~79%
* Model 7: ~60%
* Model 8: ~78%
* Model 9: ~79%
* Model 10: ~51%
* Model 11: ~65%
* Model 12: ~66%
* Model 13: ~71%
* Model 14: ~72%
* Model 15: ~80%
* Model 16: ~81%
* Model 17: ~82%
* Model 18: ~83%
* Model 19: ~83%
* Model 20: ~84%
* Model 21: ~85%
* Model 22: ~86%
* **AMMLU (Pink):**
* Trend: Starts around 70%, peaks around model 9, then decreases and stabilizes around 80%.
* Data Points:
* Model 5: ~70%
* Model 9: ~88%
* Model 14: ~78%
* Model 18: ~81%
* Model 22: ~82%
* **Humanity's Last Exam (Cyan):**
* Trend: Starts very low and increases significantly towards the end.
* Data Points:
* Model 9: ~8%
* Model 14: ~13%
* Model 16: ~24%
* Model 18: ~19%
* Model 19: ~26%
* Model 20: ~41%
* Model 21: ~35%
* Model 22: ~40%
### Key Observations
* MMLU consistently scores high across all models.
* GPQA Diamond shows significant improvement over the model numbers.
* Humanity's Last Exam starts with very low scores but shows a substantial increase in performance towards the later models.
* AMMLU has fewer data points compared to the other models.
### Interpretation
The chart illustrates the performance of different models on various benchmarks. MMLU appears to be a strong performer across all models tested. GPQA Diamond demonstrates a learning curve, with performance increasing significantly as the model number increases. Humanity's Last Exam, while starting with low scores, shows a notable improvement in later models, suggesting potential for further development. The AMMLU data is sparse, making it difficult to draw definitive conclusions about its overall performance relative to the other models. The data suggests that different models excel at different tasks or benchmarks, highlighting the importance of selecting the appropriate model for a specific application.