\n
## Diagram: Illustration of Message Passing and State Updates
### Overview
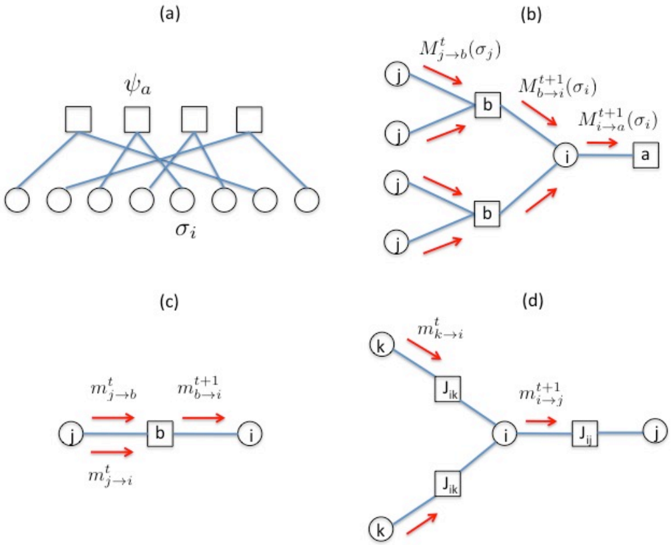
The image presents a series of four diagrams (labeled a, b, c, and d) illustrating a process involving message passing and state updates within a network or system. The diagrams appear to represent different stages or aspects of an iterative algorithm, likely related to inference or optimization. The diagrams use nodes (circles and squares) connected by directed edges (arrows) to represent entities and the flow of information.
### Components/Axes
The diagrams do not have traditional axes. Instead, they utilize nodes and directed edges to represent relationships and flow. Key elements include:
* **Nodes:** Circles labeled 'σ<sub>i</sub>', 'i', 'j', 'k', and squares labeled 'ψ<sub>a</sub>'. Rectangles labeled 'b'.
* **Edges (Arrows):** Red arrows labeled with 'M<sup>t</sup><sub>j→b</sub>(σ<sub>j</sub>)', 'M<sup>t+1</sup><sub>b→i</sub>(σ<sub>i</sub>)', 'M<sup>t+1</sup><sub>i→a</sub>(σ<sub>i</sub>)', 'm<sup>t</sup><sub>i→b</sub>', 'm<sup>t+1</sup><sub>b→i</sub>', 'm<sup>t</sup><sub>mj→i</sub>', 'm<sup>t+1</sup><sub>i→j</sub>'. Blue arrows represent connections without explicit labels.
* **Labels:** 'ψ<sub>a</sub>', 'σ<sub>i</sub>', 'a', 'b', 'i', 'j', 'k', 't', 't+1'.
* **Diagram Labels:** (a), (b), (c), (d) indicating the sequence of diagrams.
### Detailed Analysis or Content Details
**Diagram (a):**
* A set of circles labeled 'σ<sub>i</sub>' are connected to a set of squares labeled 'ψ<sub>a</sub>' via blue lines. The circles are arranged horizontally, and the squares are arranged above them. The connections appear to be many-to-many.
**Diagram (b):**
* Node 'j' sends a red arrow labeled 'M<sup>t</sup><sub>j→b</sub>(σ<sub>j</sub>)' to node 'b'.
* Node 'b' sends a red arrow labeled 'M<sup>t+1</sup><sub>b→i</sub>(σ<sub>i</sub>)' to node 'i'.
* Node 'i' sends a red arrow labeled 'M<sup>t+1</sup><sub>i→a</sub>(σ<sub>i</sub>)' to node 'a'.
* Node 'j' also sends a red arrow directly to node 'b' (duplicate path).
* Node 'b' also sends a red arrow directly to node 'i' (duplicate path).
* Blue lines connect 'j' to 'b' and 'b' to 'i' and 'i' to 'a'.
**Diagram (c):**
* Node 'i' sends a red arrow labeled 'm<sup>t</sup><sub>i→b</sub>' to node 'b'.
* Node 'b' sends a red arrow labeled 'm<sup>t+1</sup><sub>b→i</sub>' to node 'i'.
* A separate path shows 'm<sup>t</sup><sub>mj→i</sub>' from an unspecified node 'mj' to node 'i'.
**Diagram (d):**
* Node 'k' sends a red arrow labeled 'm<sup>t</sup><sub>k→i</sub>' to node 'i'.
* Node 'i' sends a red arrow labeled 'm<sup>t+1</sup><sub>i→j</sub>' to node 'j'.
* Nodes 'j<sub>ik</sub>' and 'J<sub>ij</sub>' are placed along the blue lines connecting 'i' to 'j'.
### Key Observations
* The diagrams illustrate iterative updates (indicated by 't' and 't+1' in the labels).
* The red arrows represent message passing, with the labels indicating the source, destination, and content of the message.
* The blue lines likely represent underlying connections or dependencies.
* Diagrams (b) and (d) show a more complex flow with multiple paths and intermediate nodes.
* The presence of 'σ' in the message labels suggests that the messages are related to some state variable.
### Interpretation
These diagrams likely represent a message-passing algorithm used in a probabilistic graphical model or a similar framework. The nodes represent variables or factors, and the arrows represent the exchange of information between them. The iterative updates (t and t+1) suggest that the algorithm is converging towards a solution.
* **Diagram (a)** could represent the initial state or the structure of the model.
* **Diagram (b)** illustrates a message-passing step, where messages are sent between nodes to update their beliefs. The duplication of paths suggests redundancy or multiple ways to reach a node.
* **Diagram (c)** shows a specific message-passing pattern, potentially related to a particular type of update.
* **Diagram (d)** introduces intermediate nodes (j<sub>ik</sub> and J<sub>ij</sub>) which could represent auxiliary variables or intermediate results.
The labels 'M' and 'm' likely denote different types of messages, potentially representing different aspects of the inference process. The 'σ' variable suggests that the messages are related to the state of the system. The overall process appears to be an iterative algorithm for approximating a posterior distribution or finding a maximum a posteriori (MAP) estimate. The diagrams are abstract representations of a computational process and do not provide specific numerical data. They are conceptual illustrations of the flow of information and the relationships between different components.