## Heatmap: Model Performance Across Recurrence and Hops
### Overview
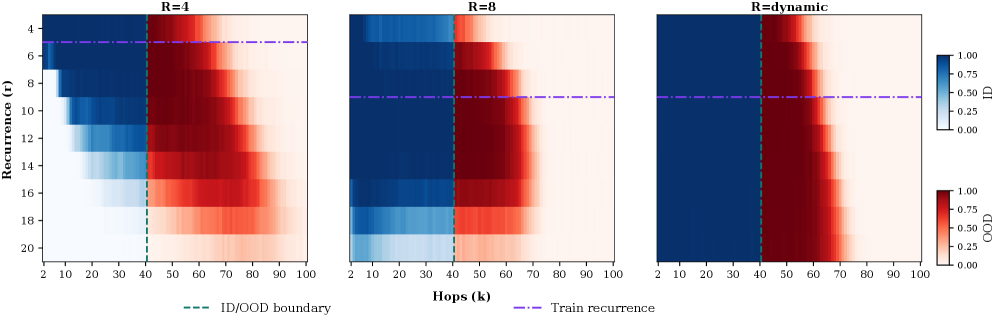
The image presents three heatmaps comparing model performance across different recurrence values (r) and hops (k) for three scenarios: fixed R=4, fixed R=8, and dynamic R. Color gradients (blue to red) represent ID/OOD classification probabilities, with dashed lines marking key boundaries.
### Components/Axes
- **X-axis (Hops, k)**: Ranges from 2 to 100 in increments of 2.
- **Y-axis (Recurrence, r)**: Ranges from 4 to 20 in increments of 2.
- **Legends**:
- **Green dashed line**: ID/OOD boundary (k=40).
- **Purple dashed line**: Train recurrence threshold (r=6).
- **Color scale**: Blue (ID, 0.00–0.75) to Red (OOD, 0.75–1.00).
### Detailed Analysis
#### R=4 Panel
- **ID/OOD Boundary**: Vertical green dashed line at k=40. Left of the line (k<40) shows dominant blue (ID), right (k>40) transitions to red (OOD).
- **Train Recurrence**: Horizontal purple dashed line at r=6. Above this line (r>6), blue dominates; below (r<6), red increases.
- **Trend**: ID/OOD separation sharpens with higher k. Recurrence values above 6 correlate with higher ID likelihood.
#### R=8 Panel
- **ID/OOD Boundary**: Same k=40 boundary. Left side (k<40) has stronger blue dominance than R=4.
- **Train Recurrence**: Purple line at r=6. Above r=6, blue dominates; below, red increases.
- **Trend**: Similar to R=4 but with a more pronounced ID/OOD split at lower k values.
#### R=dynamic Panel
- **ID/OOD Boundary**: k=40 boundary persists but with less distinct separation.
- **Train Recurrence**: Purple line at r=6. Above r=6, blue dominates; below, red increases.
- **Trend**: Uniform color distribution across k and r, suggesting reduced model confidence in dynamic R scenarios.
### Key Observations
1. **Consistent Boundaries**: The ID/OOD boundary (k=40) and train recurrence threshold (r=6) are consistent across all panels.
2. **Recurrence Sensitivity**: Higher recurrence values (r>6) correlate with increased ID likelihood, while lower values (r<6) align with OOD.
3. **Hop Threshold**: k=40 acts as a critical point where OOD probability sharply increases.
4. **Dynamic R Uncertainty**: The dynamic R panel shows no clear ID/OOD separation, indicating model instability under variable R.
### Interpretation
The data demonstrates that model performance is highly sensitive to recurrence and hop thresholds. Fixed R values (4 and 8) show predictable ID/OOD boundaries, with higher recurrence and lower hops favoring ID. The dynamic R scenario, however, lacks clear boundaries, suggesting that variable R introduces uncertainty, potentially increasing OOD risk. This highlights the importance of recurrence and hop constraints in maintaining model reliability.