## Heatmap Analysis: Recurrence and Hops
### Overview
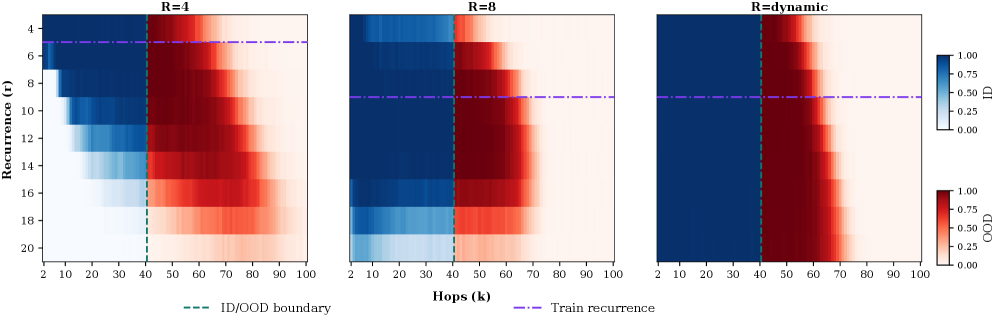
The image displays three heatmaps, each representing different configurations of recurrence (R=4, R=8, R=dynamic) and hops (k=2, k=4, k=6). The heatmaps are used to visualize the recurrence and hops of a model, with the intensity of the color indicating the level of recurrence or hops.
### Components/Axes
- **Recurrence (R)**: The x-axis represents the recurrence level, ranging from 2 to 100.
- **Hops (k)**: The y-axis represents the number of hops, ranging from 2 to 100.
- **ID/OOD boundary**: A dashed green line indicates the boundary between in-distribution (ID) and out-of-distribution (OOD) data.
- **Train recurrence**: A dashed purple line represents the recurrence level of the training data.
- **Legend**: The legend on the right side of the image provides color coding for the recurrence and hops levels.
### Detailed Analysis
- **R=4**: The heatmap shows a moderate level of recurrence, with the majority of the data points falling within the ID/OOD boundary. The recurrence level is relatively stable across different hops.
- **R=8**: The heatmap indicates a higher level of recurrence, with a significant portion of the data points falling outside the ID/OOD boundary. The recurrence level increases with the number of hops.
- **R=dynamic**: The heatmap shows a highly dynamic recurrence level, with the majority of the data points falling outside the ID/OOD boundary. The recurrence level fluctuates significantly across different hops.
### Key Observations
- **ID/OOD boundary**: The ID/OOD boundary is consistently present in all three heatmaps, indicating that the model's performance is evaluated against a standard distribution.
- **Train recurrence**: The train recurrence line is present in all three heatmaps, suggesting that the model's recurrence level is based on the training data.
- **Hops**: The number of hops affects the recurrence level, with higher hops generally resulting in higher recurrence levels.
### Interpretation
The heatmaps suggest that the model's recurrence level is influenced by both the recurrence level and the number of hops. The ID/OOD boundary indicates that the model's performance is evaluated against a standard distribution, and the train recurrence line suggests that the model's recurrence level is based on the training data. The dynamic recurrence level in the R=dynamic heatmap indicates that the model's performance is highly sensitive to the number of hops, with higher hops resulting in higher recurrence levels. This suggests that the model's performance may be affected by the complexity of the data and the number of hops used in the model.