## Diagram: In-Ear Noise Processing Pipeline
### Overview
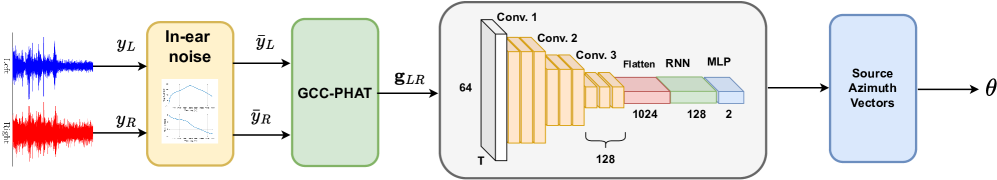
The image presents a block diagram illustrating a signal processing pipeline for estimating the source azimuth from in-ear noise. The pipeline consists of several stages: capturing left and right ear signals, processing them to remove in-ear noise, applying GCC-PHAT (Generalized Cross-Correlation with Phase Transform), feeding the result into a convolutional neural network (CNN) followed by a recurrent neural network (RNN) and a multilayer perceptron (MLP), and finally outputting source azimuth vectors.
### Components/Axes
* **Input:**
* `yL`: Left ear signal (time-domain waveform, shown in blue).
* `yR`: Right ear signal (time-domain waveform, shown in red).
* **Block 1: In-ear noise:**
* Label: "In-ear noise"
* Input: `yL`, `yR`
* Output: `ȳL`, `ȳR` (noise-reduced left and right ear signals)
* Internal: Contains a plot of two waveforms, one above the other. The top waveform starts high and decreases, while the bottom waveform starts low and decreases.
* **Block 2: GCC-PHAT:**
* Label: "GCC-PHAT"
* Input: `ȳL`, `ȳR`
* Output: `gLR`
* **Block 3: CNN-RNN-MLP Network:**
* Input: `gLR`
* Architecture:
* Convolutional Layers: "Conv. 1", "Conv. 2", "Conv. 3" (represented as stacked yellow blocks, decreasing in size).
* Flatten Layer: "Flatten" (represented as a red block).
* Recurrent Neural Network: "RNN" (represented as a green block).
* Multilayer Perceptron: "MLP" (represented as a light blue block).
* Dimensions:
* Input depth: 64
* Convolutional filter width: 128
* Flattened layer size: 1024
* RNN layer size: 128
* MLP output size: 2
* **Block 4: Source Azimuth Vectors:**
* Label: "Source Azimuth Vectors"
* Input: Output of the CNN-RNN-MLP network.
* Output: `θ` (estimated source azimuth).
### Detailed Analysis
* **Signal Flow:** The diagram shows a clear flow of information from the initial ear signals to the final azimuth estimation.
* **In-ear Noise Block:** This block represents a pre-processing step to reduce noise present in the ear signals. The internal plot suggests some form of filtering or noise cancellation.
* **GCC-PHAT Block:** This block calculates the Generalized Cross-Correlation with Phase Transform, a technique used for time delay estimation between the left and right ear signals.
* **CNN-RNN-MLP Network:** This network is the core of the azimuth estimation system. The CNN likely extracts features from the GCC-PHAT output, the RNN models temporal dependencies, and the MLP maps these features to the azimuth angle.
* **Layer Dimensions:** The dimensions of the layers (64, 128, 1024, 2) provide information about the network's capacity and complexity.
### Key Observations
* The pipeline combines traditional signal processing techniques (GCC-PHAT) with deep learning methods (CNN, RNN, MLP).
* The network architecture is designed to handle both spatial and temporal information in the ear signals.
* The final output is a 2-dimensional vector, which likely represents the azimuth angle in some coordinate system.
### Interpretation
The diagram illustrates a sophisticated approach to estimating the direction of a sound source using in-ear noise. The combination of GCC-PHAT and a deep neural network allows the system to leverage both the precise time delay information captured by GCC-PHAT and the powerful feature extraction capabilities of deep learning. The CNN-RNN-MLP architecture suggests that the system is designed to handle complex acoustic environments and potentially track moving sound sources. The 2-dimensional output vector likely represents the azimuth angle in a polar or Cartesian coordinate system, allowing for precise localization of the sound source.