\n
## Diagram: Audio Source Localization Pipeline
### Overview
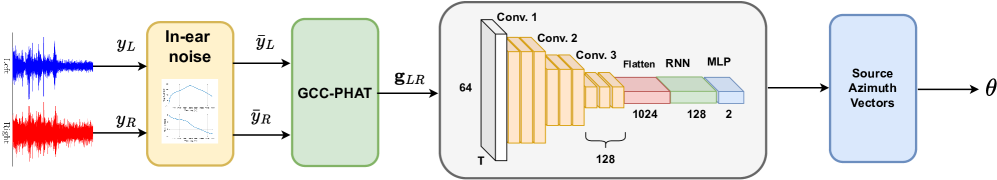
This diagram illustrates a pipeline for localizing audio sources. It takes two input audio signals (left and right) and processes them through several stages, including noise estimation, cross-correlation, convolutional neural networks (CNNs), recurrent neural networks (RNNs), and a multi-layer perceptron (MLP) to ultimately estimate the source azimuth angle (θ).
### Components/Axes
The diagram consists of four main blocks, arranged horizontally from left to right:
1. **Input:** Two audio signals, denoted as y<sub>L</sub> (left, blue) and y<sub>R</sub> (right, red). Also includes "In-ear noise" with plots of the signals.
2. **GCC-PHAT:** A Generalized Cross-Correlation with Phase Transform (GCC-PHAT) block, taking the left and right signals as input and producing g<sub>LR</sub>.
3. **CNN-RNN-MLP Network:** A deep learning network consisting of three convolutional layers (Conv. 1, Conv. 2, Conv. 3), a flatten layer, a recurrent neural network (RNN), and a multi-layer perceptron (MLP).
4. **Output:** Source Azimuth Vectors, represented by the angle θ.
The CNN-RNN-MLP network block also includes dimension annotations: 64, T, 128, 1024, 128, and 2.
### Detailed Analysis or Content Details
1. **Input Signals:** The left signal (y<sub>L</sub>) is represented in blue, and the right signal (y<sub>R</sub>) is represented in red. The "In-ear noise" block contains two plots, one for each signal, showing their waveforms.
2. **GCC-PHAT Block:** This block takes the left and right signals and outputs g<sub>LR</sub>. The block is light green.
3. **CNN-RNN-MLP Network:**
* **Conv. 1:** Input dimension T, output dimension 128. The block is colored in shades of orange.
* **Conv. 2:** Input dimension 128, output dimension 128.
* **Conv. 3:** Input dimension 128, output dimension 64.
* **Flatten:** Converts the output of Conv. 3 into a 1024-dimensional vector.
* **RNN:** Takes the 1024-dimensional vector as input and outputs a 128-dimensional vector. The RNN block is colored in red.
* **MLP:** Takes the 128-dimensional vector as input and outputs a 2-dimensional vector. The MLP block is colored in blue.
4. **Output:** The output is "Source Azimuth Vectors" represented by the angle θ. The block is light blue.
### Key Observations
The diagram shows a clear flow of information from the input audio signals through a series of processing stages to the final output of source azimuth angle. The deep learning network is the core of the pipeline, utilizing CNNs for feature extraction, an RNN for temporal modeling, and an MLP for final prediction. The dimension annotations provide insight into the network's architecture.
### Interpretation
This diagram represents a system for sound source localization, likely intended for applications like hearing aids or robotics. The use of GCC-PHAT suggests a time-delay-of-arrival (TDOA) based approach, which is then refined by the deep learning network. The CNNs likely extract relevant features from the GCC-PHAT output, the RNN captures temporal dependencies in the audio signal, and the MLP maps these features to the final azimuth angle. The dimension annotations suggest a relatively compact network architecture. The system aims to estimate the direction (azimuth angle θ) from which a sound is originating. The "In-ear noise" block suggests that the system is designed to operate in noisy environments.