## Bar Chart: Gemini 1.5 Pro Ratings
### Overview
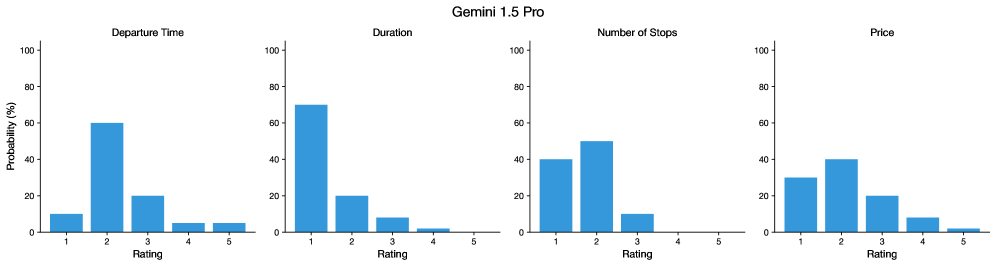
The image presents four bar charts side-by-side, each displaying the probability distribution of ratings for a different aspect of travel: Departure Time, Duration, Number of Stops, and Price. The ratings are on a scale of 1 to 5, and the probability is expressed as a percentage. The title of the image is "Gemini 1.5 Pro".
### Components/Axes
* **Title:** Gemini 1.5 Pro
* **X-axis (horizontal):** Rating (values 1 to 5)
* **Y-axis (vertical):** Probability (%) (scale from 0 to 100)
* **Chart Titles (top of each chart):**
* Departure Time
* Duration
* Number of Stops
* Price
* **Bar Color:** Blue
### Detailed Analysis
**1. Departure Time:**
* Trend: The probability peaks at rating 2, then decreases.
* Rating 1: Approximately 10%
* Rating 2: Approximately 60%
* Rating 3: Approximately 20%
* Rating 4: Approximately 5%
* Rating 5: Approximately 5%
**2. Duration:**
* Trend: The probability decreases as the rating increases.
* Rating 1: Approximately 70%
* Rating 2: Approximately 20%
* Rating 3: Approximately 8%
* Rating 4: Approximately 2%
* Rating 5: Approximately 1%
**3. Number of Stops:**
* Trend: The probability peaks at rating 2, then decreases.
* Rating 1: Approximately 40%
* Rating 2: Approximately 50%
* Rating 3: Approximately 10%
* Rating 4: Approximately 0%
* Rating 5: Approximately 0%
**4. Price:**
* Trend: The probability peaks at rating 2, then decreases.
* Rating 1: Approximately 30%
* Rating 2: Approximately 40%
* Rating 3: Approximately 20%
* Rating 4: Approximately 8%
* Rating 5: Approximately 2%
### Key Observations
* For Departure Time, the highest probability is at rating 2.
* For Duration, the highest probability is at rating 1.
* For Number of Stops, the highest probability is at rating 2.
* For Price, the highest probability is at rating 2.
* In all four charts, higher ratings (4 and 5) have very low probabilities.
### Interpretation
The data suggests that, according to Gemini 1.5 Pro, users generally prefer trips with a rating of 2 for Departure Time, Number of Stops, and Price. They strongly prefer a rating of 1 for Duration. This could indicate a preference for shorter trips, but some flexibility or tolerance for departure times, number of stops, and price. The low probabilities for ratings 4 and 5 across all categories suggest that users generally avoid or dislike trips with those characteristics. The model seems to be capturing user preferences for certain travel characteristics.