## Bar Chart: Effect of OOD Distractors on Success Rates
### Overview
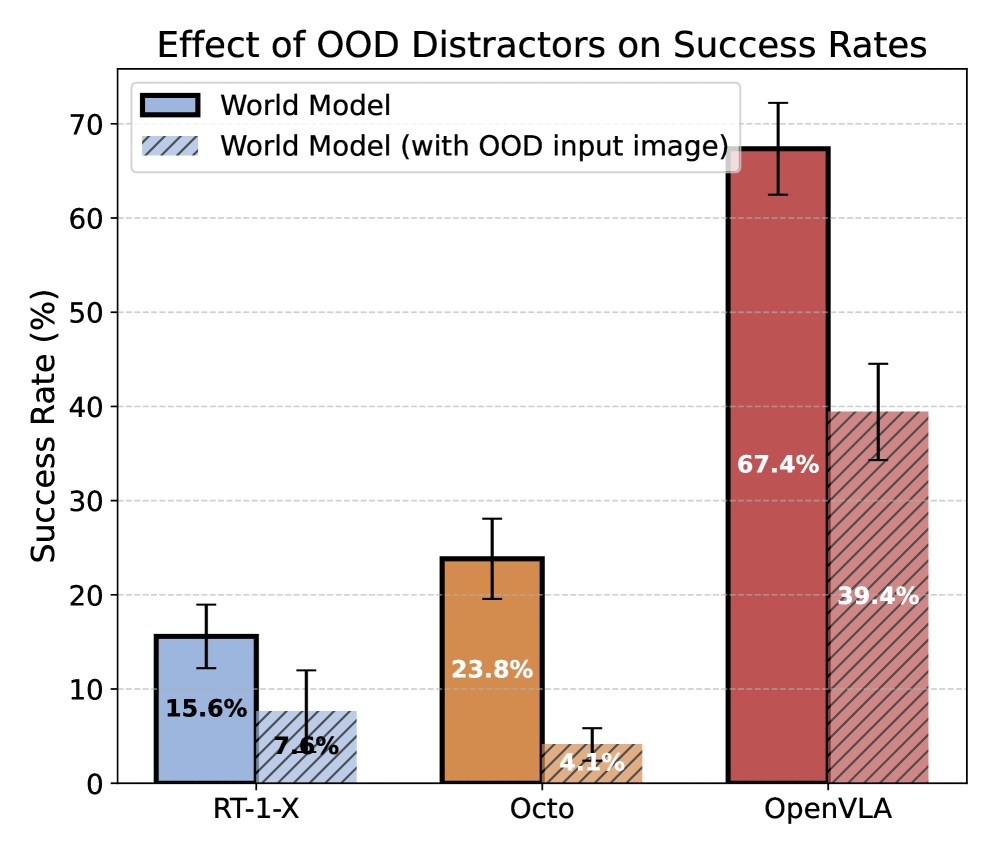
The image is a bar chart comparing the success rates of a "World Model" and a "World Model (with OOD input image)" across three different systems: RT-1-X, Octo, and OpenVLA. The chart displays success rates as percentages, with error bars indicating variability.
### Components/Axes
* **Title:** Effect of OOD Distractors on Success Rates
* **Y-axis:** Success Rate (%)
* Scale: 0% to 70%, with gridlines at intervals of 10%.
* **X-axis:** Systems (RT-1-X, Octo, OpenVLA)
* **Legend:** Located at the top of the chart.
* **World Model:** Solid color bars with black outlines.
* **World Model (with OOD input image):** Hatched bars.
### Detailed Analysis
* **RT-1-X:**
* World Model (light blue): 15.6%
* World Model (with OOD input image) (light blue, hatched): 7.6%
* **Octo:**
* World Model (orange): 23.8%
* World Model (with OOD input image) (orange, hatched): 4.1%
* **OpenVLA:**
* World Model (red): 67.4%
* World Model (with OOD input image) (red, hatched): 39.4%
### Key Observations
* The "World Model" consistently outperforms the "World Model (with OOD input image)" across all three systems.
* OpenVLA has the highest success rates for both models, followed by Octo, and then RT-1-X.
* The difference in success rates between the two models is most pronounced for OpenVLA.
### Interpretation
The chart demonstrates the negative impact of Out-of-Distribution (OOD) input images on the success rates of the "World Model." The "World Model (with OOD input image)" consistently shows lower success rates compared to the standard "World Model," indicating that OOD inputs act as distractors and reduce performance. The OpenVLA system, while having the highest overall success rates, is also the most affected by OOD inputs, suggesting that its performance is more sensitive to the quality of the input data. The error bars indicate the variability in the data, and while not explicitly quantified, they suggest that the observed differences are statistically significant.