## Line Chart: Energy vs. ε(π) for different Ks values
### Overview
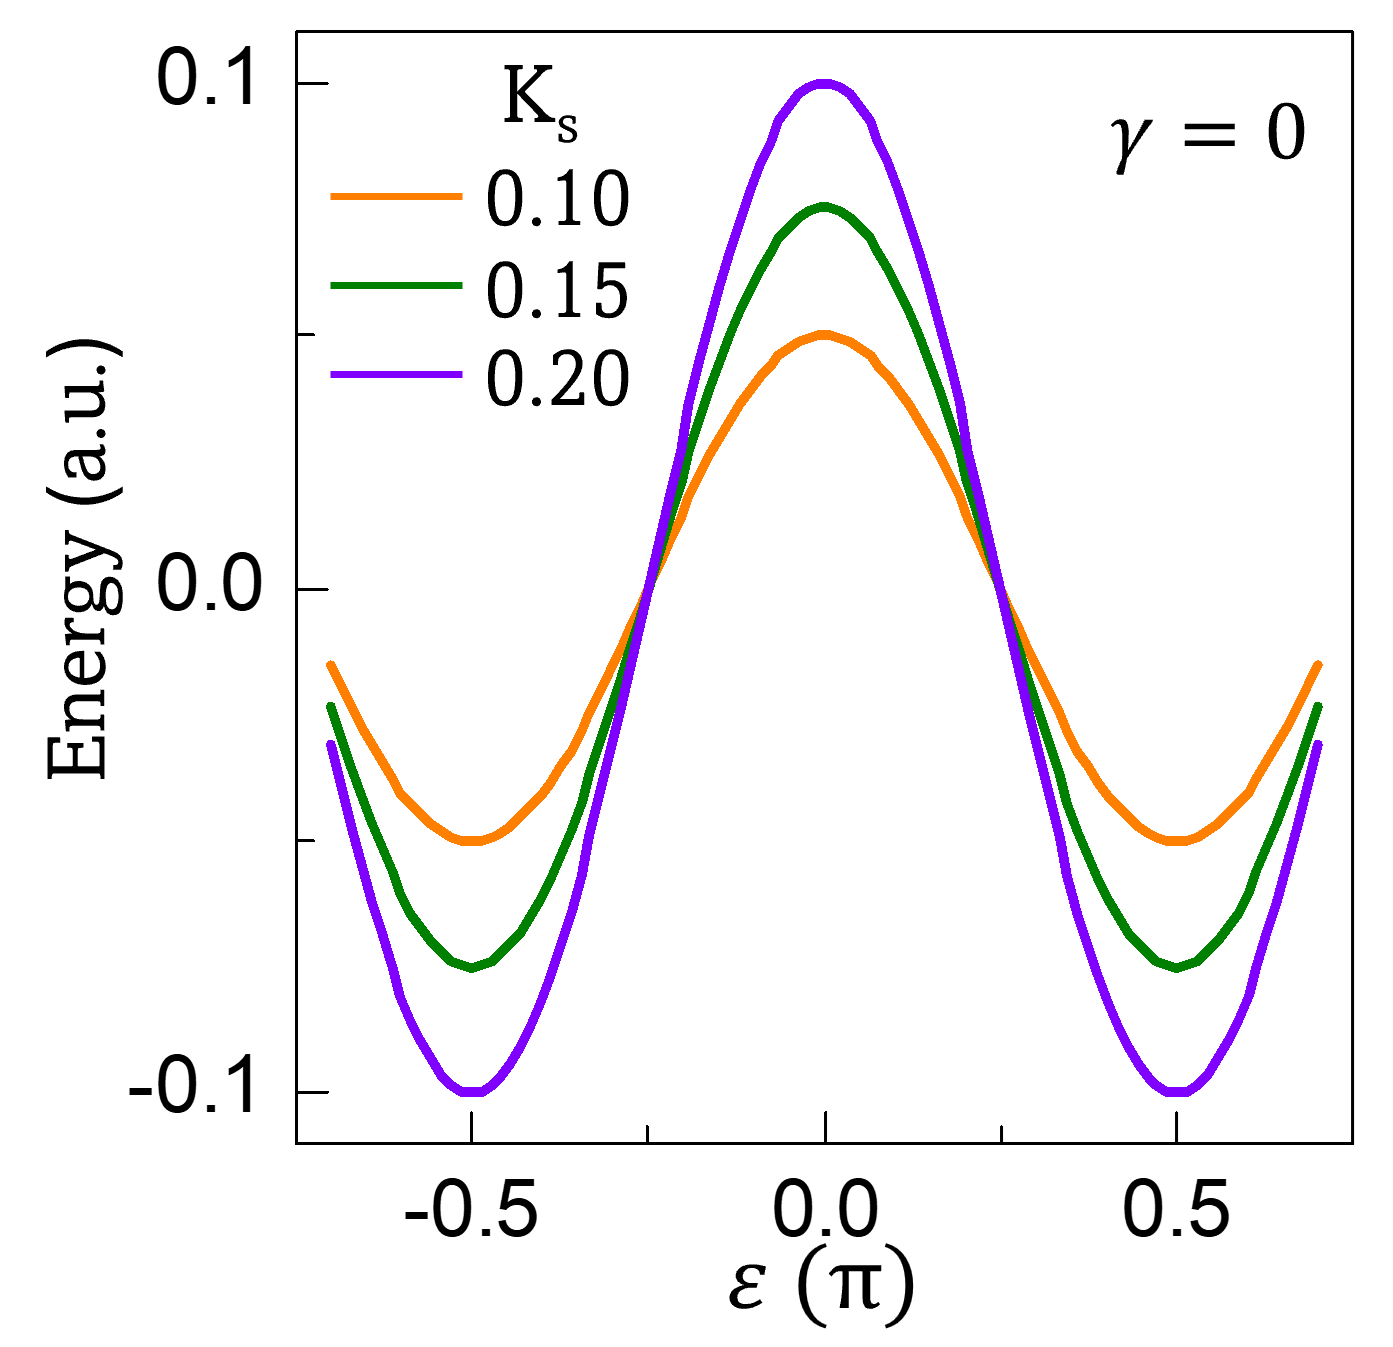
The image is a line chart displaying the relationship between Energy (in arbitrary units) and ε(π) for three different values of Ks (0.10, 0.15, and 0.20). The chart shows how energy changes as a function of ε(π) for each Ks value, with γ held constant at 0.
### Components/Axes
* **X-axis:** ε(π), ranging from -0.5 to 0.5. Markers are present at -0.5, 0.0, and 0.5.
* **Y-axis:** Energy (a.u.), ranging from -0.1 to 0.1. Markers are present at -0.1, 0.0, and 0.1.
* **Legend (Top-Left):**
* Orange line: Ks = 0.10
* Green line: Ks = 0.15
* Purple line: Ks = 0.20
* **Title (Top-Right):** γ = 0
### Detailed Analysis
* **Orange Line (Ks = 0.10):**
* Trend: Starts at approximately -0.04 at ε(π) = -0.5, rises to a peak of approximately 0.06 at ε(π) = 0.0, and then decreases back to approximately -0.04 at ε(π) = 0.5.
* **Green Line (Ks = 0.15):**
* Trend: Starts at approximately -0.07 at ε(π) = -0.5, rises to a peak of approximately 0.08 at ε(π) = 0.0, and then decreases back to approximately -0.07 at ε(π) = 0.5.
* **Purple Line (Ks = 0.20):**
* Trend: Starts at approximately -0.1 at ε(π) = -0.5, rises to a peak of approximately 0.1 at ε(π) = 0.0, and then decreases back to approximately -0.1 at ε(π) = 0.5.
### Key Observations
* All three lines exhibit a similar U-shaped curve, with a minimum at ε(π) = -0.5 and 0.5, and a maximum at ε(π) = 0.0.
* As the value of Ks increases, the amplitude of the curve also increases. The purple line (Ks = 0.20) has the largest amplitude, while the orange line (Ks = 0.10) has the smallest.
* The curves are symmetrical around ε(π) = 0.0.
### Interpretation
The chart illustrates the relationship between energy and ε(π) for different values of Ks, while γ is held constant. The data suggests that as Ks increases, the energy range also increases. The symmetrical U-shape of the curves indicates a specific type of relationship between energy and ε(π), possibly related to a physical system with a periodic potential or a similar characteristic. The fact that γ = 0 might indicate a specific condition or simplification in the model being represented.