\n
## Chart: Energy vs. Strain for Different K<sub>s</sub> Values
### Overview
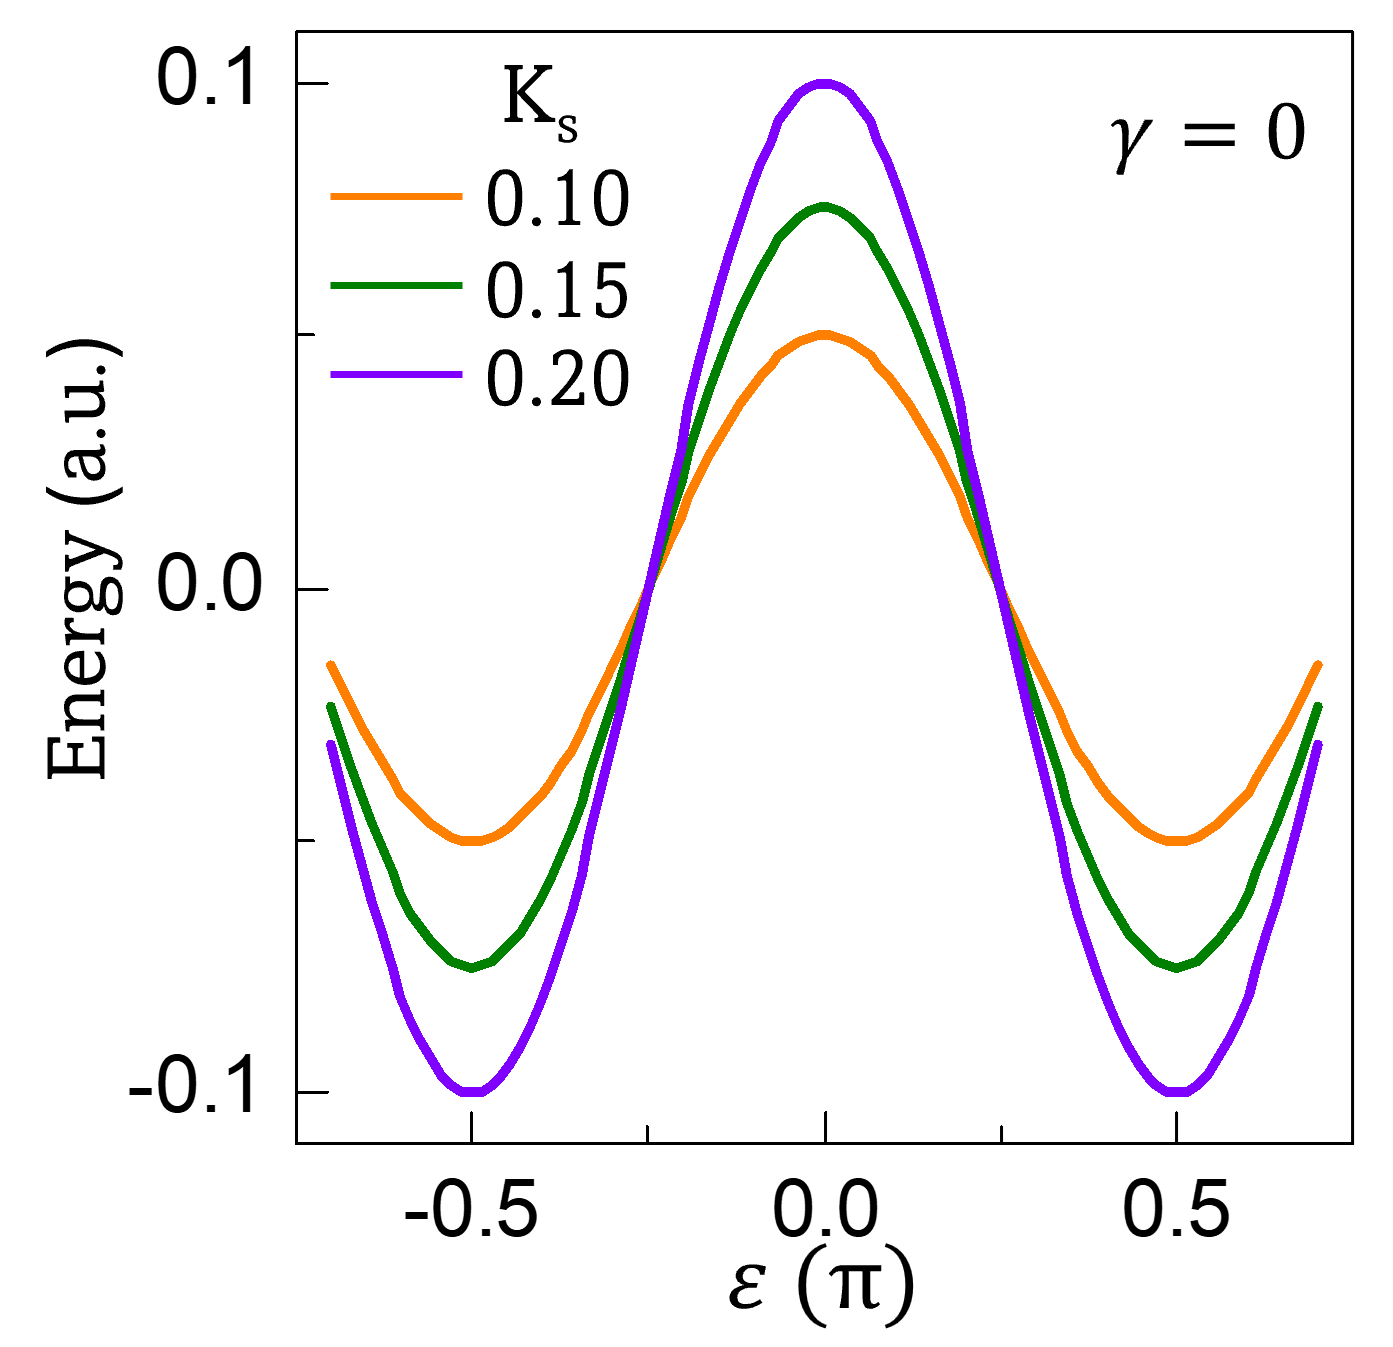
The image presents a line chart illustrating the relationship between Energy (in arbitrary units, a.u.) and Strain (ε, in units of π) for three different values of K<sub>s</sub> (0.10, 0.15, and 0.20) with γ = 0. The chart depicts the energy landscape as a function of strain, showing how the energy changes with deformation for each K<sub>s</sub> value.
### Components/Axes
* **X-axis:** Strain (ε) measured in units of π. The axis ranges from approximately -0.55 to 0.55.
* **Y-axis:** Energy measured in arbitrary units (a.u.). The axis ranges from approximately -0.12 to 0.11.
* **Legend:** Located in the top-left corner, the legend identifies the three lines by their corresponding K<sub>s</sub> values and colors:
* K<sub>s</sub> = 0.10 (Orange)
* K<sub>s</sub> = 0.15 (Green)
* K<sub>s</sub> = 0.20 (Purple)
* **Annotation:** γ = 0 is written in the top-right corner.
### Detailed Analysis
The chart displays three curves, each representing a different K<sub>s</sub> value.
* **K<sub>s</sub> = 0.10 (Orange Line):** This line exhibits a symmetrical parabolic shape. The minimum energy is located at ε = 0. The energy at ε = 0 is approximately 0.00 a.u. The energy at ε = -0.5 and ε = 0.5 is approximately 0.08 a.u.
* **K<sub>s</sub> = 0.15 (Green Line):** This line also shows a symmetrical parabolic shape, but the curve is narrower than the orange line. The minimum energy is located at ε = 0. The energy at ε = 0 is approximately 0.00 a.u. The energy at ε = -0.5 and ε = 0.5 is approximately 0.06 a.u.
* **K<sub>s</sub> = 0.20 (Purple Line):** This line is the narrowest of the three, indicating a steeper energy landscape. The minimum energy is located at ε = 0. The energy at ε = 0 is approximately 0.00 a.u. The energy at ε = -0.5 and ε = 0.5 is approximately 0.04 a.u.
All three lines intersect at the point (0, 0), where the strain is zero and the energy is zero.
### Key Observations
* As K<sub>s</sub> increases, the energy landscape becomes steeper, meaning that a larger force is required to deform the material by the same amount.
* The minimum energy for all three K<sub>s</sub> values occurs at zero strain (ε = 0).
* The curves are all symmetrical around the y-axis, indicating that the energy landscape is the same for positive and negative strain.
### Interpretation
The chart demonstrates the relationship between energy and strain for different values of a parameter K<sub>s</sub>, likely representing a stiffness or spring constant. The parabolic shapes suggest a simple harmonic oscillator-like behavior, where the energy increases quadratically with strain. The higher the K<sub>s</sub> value, the stiffer the system, and the more energy is required to achieve a given strain. The γ = 0 annotation suggests that damping is absent in this model. The data suggests that increasing K<sub>s</sub> leads to a more resistant material, requiring more energy to deform. The symmetry of the curves indicates that the material behaves identically under tensile and compressive strain. This type of plot is common in solid-state physics or materials science to model the potential energy surface of a crystal lattice or a material under stress.