## Line Graph: Energy vs. ε (π) with Varying K_s Values
### Overview
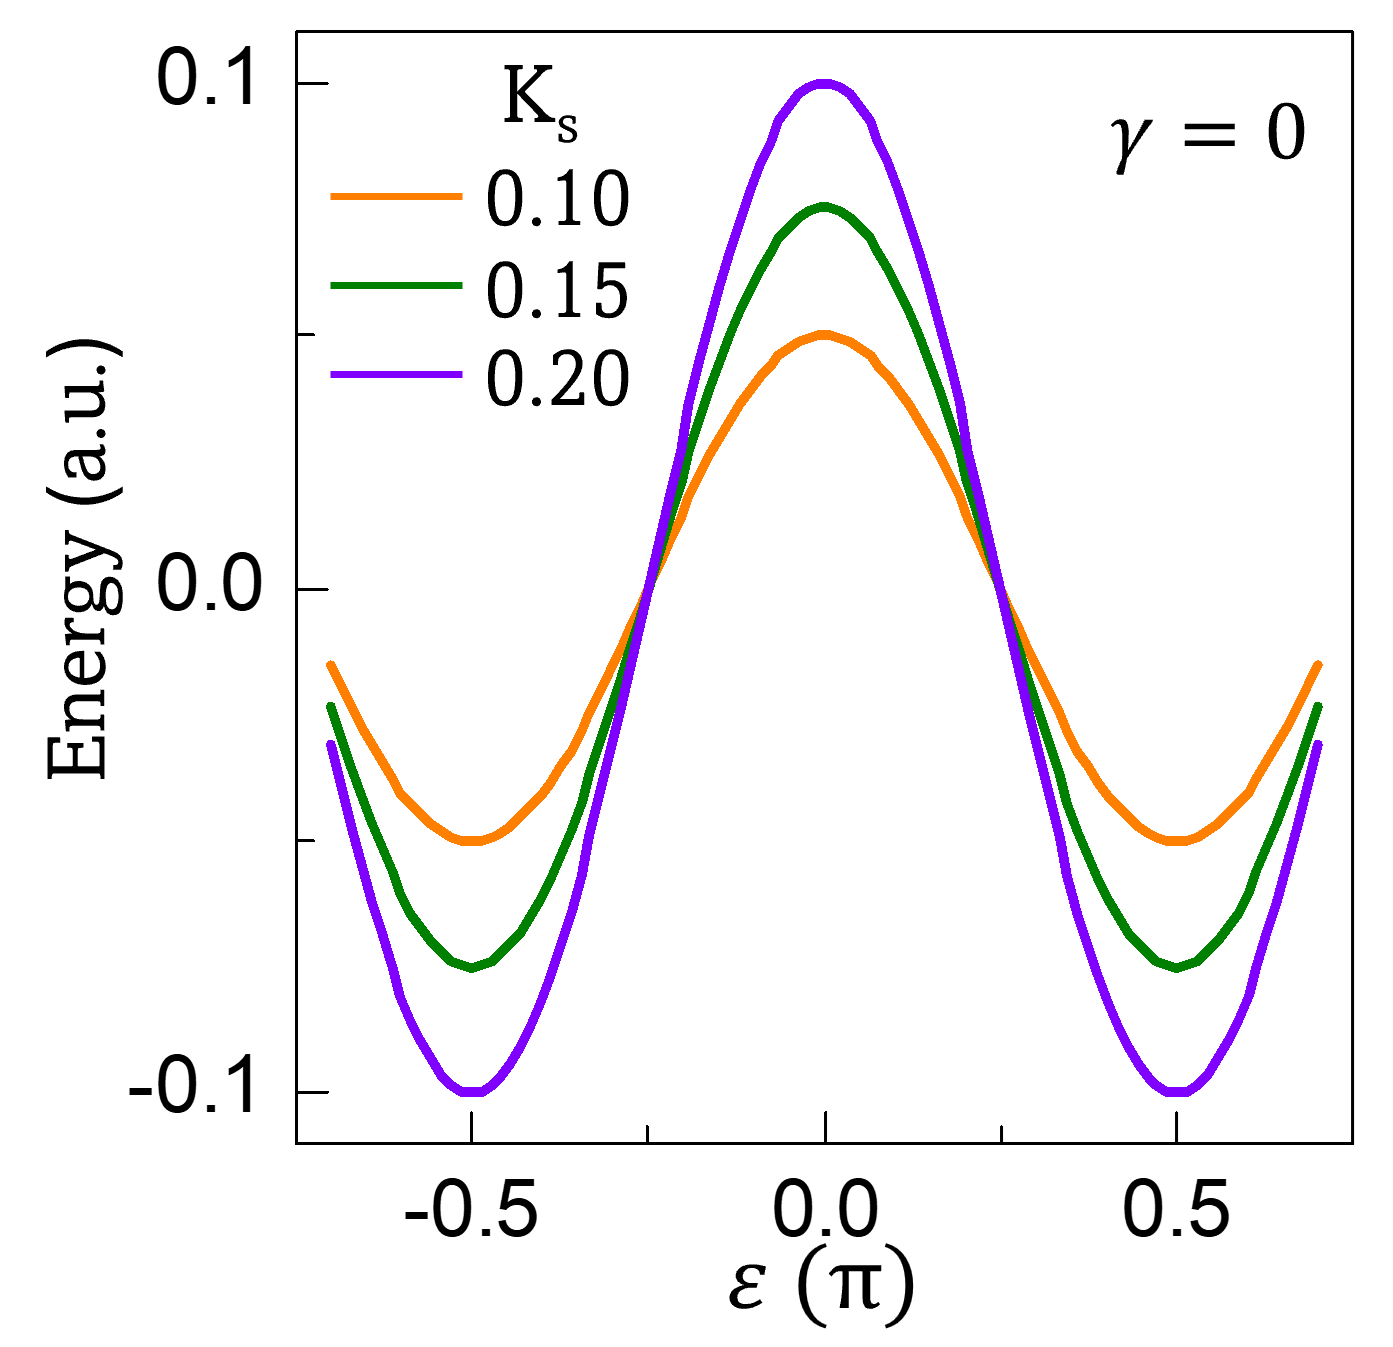
The graph depicts three energy curves plotted against ε (π), with distinct peaks and troughs. Each curve corresponds to a different K_s value (0.10, 0.15, 0.20), represented by orange, green, and purple lines respectively. The y-axis measures energy in arbitrary units (a.u.), while the x-axis ranges from -0.5 to 0.5 in ε (π). A label "γ = 0" is positioned in the top-right corner.
---
### Components/Axes
- **Y-Axis**: Labeled "Energy (a.u.)" with ticks at -0.1, 0.0, and 0.1.
- **X-Axis**: Labeled "ε (π)" with ticks at -0.5, 0.0, and 0.5.
- **Legend**: Located on the right side, associating:
- Orange line → K_s = 0.10
- Green line → K_s = 0.15
- Purple line → K_s = 0.20
- **Additional Text**: "γ = 0" in the top-right corner.
---
### Detailed Analysis
1. **Curve Trends**:
- **Purple (K_s = 0.20)**: Highest peak at ε = 0 (~0.08 a.u.), deepest trough at ε = ±0.5 (~-0.08 a.u.).
- **Green (K_s = 0.15)**: Intermediate peak (~0.06 a.u.) and trough (~-0.06 a.u.).
- **Orange (K_s = 0.10)**: Lowest peak (~0.04 a.u.) and trough (~-0.04 a.u.).
- All curves are symmetric about ε = 0, forming parabolic-like shapes.
2. **Key Data Points**:
- At ε = 0:
- Purple: ~0.08 a.u.
- Green: ~0.06 a.u.
- Orange: ~0.04 a.u.
- At ε = ±0.5:
- Purple: ~-0.08 a.u.
- Green: ~-0.06 a.u.
- Orange: ~-0.04 a.u.
---
### Key Observations
- **Symmetry**: All curves exhibit even symmetry (mirror-image behavior around ε = 0).
- **K_s Dependency**: Higher K_s values correlate with increased energy magnitude (both peaks and troughs).
- **Spacing**: Curves are closely spaced, suggesting a gradual relationship between K_s and energy.
---
### Interpretation
The graph likely models a quantum mechanical or vibrational system where K_s represents a coupling constant or interaction strength. The symmetry implies the system has even parity (e.g., a harmonic oscillator or particle in a symmetric potential). The γ = 0 label suggests no damping or external perturbation is considered. The energy levels' dependence on K_s indicates that stronger interactions (higher K_s) result in more pronounced energy states, which could relate to binding energy, resonance frequencies, or stability thresholds in the system.