## Chart: Age-Related Infection and Mortality Rates in Spain
### Overview
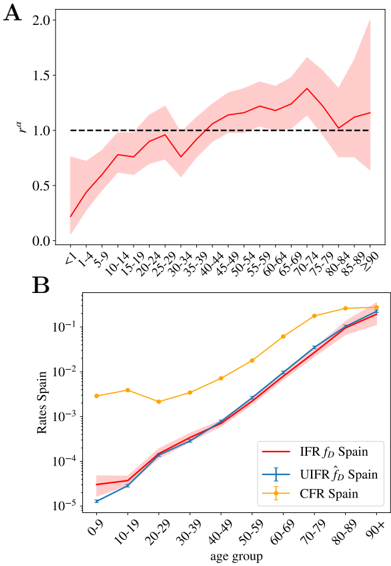
The image presents two charts (A and B) that analyze age-related infection and mortality rates in Spain. Chart A displays the ratio *r*<sup>α</sup> across different age groups, while Chart B compares Infection Fatality Rate (IFR), Unbiased Infection Fatality Rate (UIFR), and Case Fatality Rate (CFR) in Spain across various age groups.
### Components/Axes
**Chart A:**
* **Title:** Implicit, but the chart analyzes age-related ratios.
* **Y-axis:** *r*<sup>α</sup>, ranging from 0.0 to 2.0 in increments of 0.5.
* **X-axis:** Age groups: <1, 1-4, 5-9, 10-14, 15-19, 20-24, 25-29, 30-34, 35-39, 40-44, 45-49, 50-54, 55-59, 60-64, 65-69, 70-74, 75-79, 80-84, 85-89, ≥90.
* **Data:** A red line with a shaded red region indicating uncertainty. A horizontal dashed black line is present at *r*<sup>α</sup> = 1.0.
**Chart B:**
* **Title:** Implicit, but the chart compares IFR, UIFR, and CFR in Spain.
* **Y-axis:** Rates Spain, on a logarithmic scale from 10<sup>-5</sup> to 10<sup>-1</sup>.
* **X-axis:** Age group: 0-9, 10-19, 20-29, 30-39, 40-49, 50-59, 60-69, 70-79, 80-89, 90+.
* **Data:**
* **IFR *f*<sub>D</sub> Spain:** Red line with a shaded red region indicating uncertainty.
* **UIFR *f*̂<sub>D</sub> Spain:** Blue line with error bars.
* **CFR Spain:** Yellow line with error bars.
* **Legend:** Located in the bottom-right corner of Chart B.
### Detailed Analysis
**Chart A:**
* The red line starts at approximately 0.25 for the <1 age group.
* It generally increases with age, fluctuating between 0.7 and 1.0 until the 40-44 age group.
* From 40-44 onwards, the line remains mostly above 1.0, reaching approximately 1.2 around the 70-74 age group.
* The uncertainty (shaded red region) increases with age.
**Chart B:**
* **IFR *f*<sub>D</sub> Spain (Red):** Starts at approximately 10<sup>-5</sup> for the 0-9 age group and increases steadily to approximately 10<sup>-2</sup> for the 90+ age group. The shaded red region indicates uncertainty.
* **UIFR *f*̂<sub>D</sub> Spain (Blue):** Starts at approximately 10<sup>-5</sup> for the 0-9 age group and increases steadily to approximately 10<sup>-2</sup> for the 90+ age group. Error bars are present at each data point.
* **CFR Spain (Yellow):** Starts at approximately 5 * 10<sup>-4</sup> for the 0-9 age group, remains relatively flat until the 30-39 age group, and then increases to approximately 2 * 10<sup>-2</sup> for the 90+ age group. Error bars are present at each data point.
### Key Observations
* In Chart A, *r*<sup>α</sup> generally increases with age, suggesting a higher relative risk for older age groups.
* In Chart B, IFR and UIFR are very similar and increase steadily with age.
* CFR is higher than IFR and UIFR for younger age groups but converges with them in older age groups.
* The logarithmic scale in Chart B highlights the exponential increase in rates with age.
### Interpretation
The charts provide insights into the age-related dynamics of infection and mortality in Spain. Chart A suggests that the relative risk, represented by *r*<sup>α</sup>, increases with age, indicating that older individuals are more vulnerable. Chart B demonstrates that both IFR and UIFR increase exponentially with age, reflecting the higher mortality risk associated with COVID-19 in older populations. The CFR, which is initially higher than IFR and UIFR in younger age groups, likely reflects a higher proportion of detected cases in these groups. As age increases, the CFR converges with IFR and UIFR, suggesting that a larger proportion of infections in older individuals result in reported cases and, ultimately, mortality. The similarity between IFR and UIFR suggests that the unbiased estimation method provides a reliable measure of infection fatality rates.