## Charts: Age-Specific Infection and Fatality Rates in Spain
### Overview
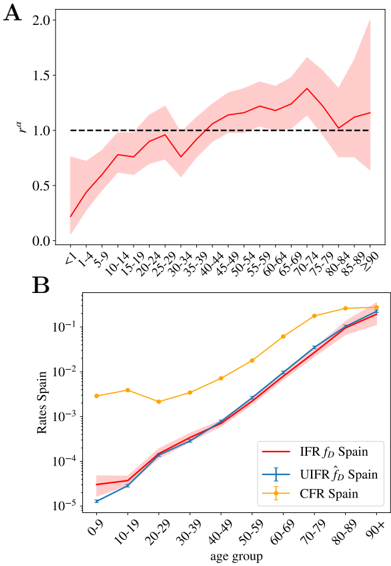
The image presents two charts (labeled A and B) depicting age-specific infection and fatality rates in Spain. Chart A shows the Infection Fatality Ratio (IFR) with a confidence interval, while Chart B displays the Infection Fatality Ratio (IFR), Underreporting Factor (UIFR), and Case Fatality Ratio (CFR) on a logarithmic scale, all as functions of age group.
### Components/Axes
**Chart A:**
* **Y-axis:** IFR (Infection Fatality Ratio), ranging from 0.0 to 2.0.
* **X-axis:** Age Group, with categories: <1, 1-4, 5-9, 10-14, 15-19, 20-24, 25-29, 30-34, 35-39, 40-44, 45-49, 50-54, 55-59, 60-64, 65-69, 70-74, 75-79, 80-84, 85-89, 90+.
* **Line:** Red line representing the IFR.
* **Shaded Area:** Light red area representing the confidence interval around the IFR.
* **Horizontal Dashed Line:** A horizontal dashed line at IFR = 1.0.
**Chart B:**
* **Y-axis:** Rates Spain, on a logarithmic scale from 10<sup>-5</sup> to 10<sup>1</sup>.
* **X-axis:** Age Group, with categories: 0-9, 10-19, 20-29, 30-39, 40-49, 50-59, 60-59, 70-79, 80-89, 90+.
* **Lines:**
* Red line representing IFR<sub>fd</sub> Spain.
* Yellow line representing UIFR<sub>fd</sub> Spain.
* Blue line representing CFR Spain.
* **Legend:** Located in the bottom-left corner, associating colors with the respective rates.
### Detailed Analysis or Content Details
**Chart A:**
The red line representing the IFR generally increases with age.
* For age groups <1 to 30-34, the IFR is below 1.0, fluctuating between approximately 0.1 and 0.8.
* From age group 35-39 onwards, the IFR consistently exceeds 1.0, reaching a peak of approximately 1.6 for the 85-89 age group.
* The confidence interval (shaded area) widens with increasing age, indicating greater uncertainty in the IFR estimates for older age groups.
**Chart B:**
All three rates (IFR, UIFR, CFR) increase with age, but at different rates and magnitudes. The Y-axis is logarithmic, so the visual slope represents the rate of increase.
* **IFR<sub>fd</sub> Spain (Red Line):** Starts at approximately 2 x 10<sup>-5</sup> for the 0-9 age group and increases to approximately 8 x 10<sup>-3</sup> for the 90+ age group. The line shows a relatively steady increase, becoming steeper for older age groups.
* **UIFR<sub>fd</sub> Spain (Yellow Line):** Starts at approximately 3 x 10<sup>-4</sup> for the 0-9 age group and increases to approximately 2 x 10<sup>-1</sup> for the 90+ age group. The line initially plateaus between 10-19 and 30-39, then increases more rapidly.
* **CFR Spain (Blue Line):** Starts at approximately 1 x 10<sup>-5</sup> for the 0-9 age group and increases to approximately 5 x 10<sup>-2</sup> for the 90+ age group. The line shows a consistent, but less steep, increase compared to the IFR and UIFR.
### Key Observations
* Both charts demonstrate a clear positive correlation between age and the risk of severe outcomes (IFR, CFR).
* The UIFR (Underreporting Factor) is significantly higher than both the IFR and CFR, suggesting substantial underreporting of infections, especially in older age groups.
* The confidence interval in Chart A is wider for older age groups, indicating greater uncertainty in the IFR estimates.
* The logarithmic scale in Chart B emphasizes the exponential increase in rates with age.
### Interpretation
The data suggests that the severity of infection, as measured by the IFR, increases substantially with age in Spain. The CFR, while lower than the IFR, also exhibits a similar age-related increase, indicating that older individuals are more likely to die from the infection. The high UIFR suggests that the true number of infections is significantly higher than the reported number, particularly among older populations. This could be due to factors such as asymptomatic infections, limited testing, or reluctance to seek medical attention. The widening confidence intervals in Chart A for older age groups may reflect smaller sample sizes or increased variability in the population. The logarithmic scale in Chart B highlights the disproportionate increase in risk for older age groups, emphasizing the need for targeted interventions to protect this vulnerable population. The difference between the IFR and CFR indicates that many infections are not fatal, but the IFR still shows a significant risk increase with age. The data supports the prioritization of vaccination and other preventative measures for older individuals.