## Flowchart: Multi-Stage Process with Labeled Components
### Overview
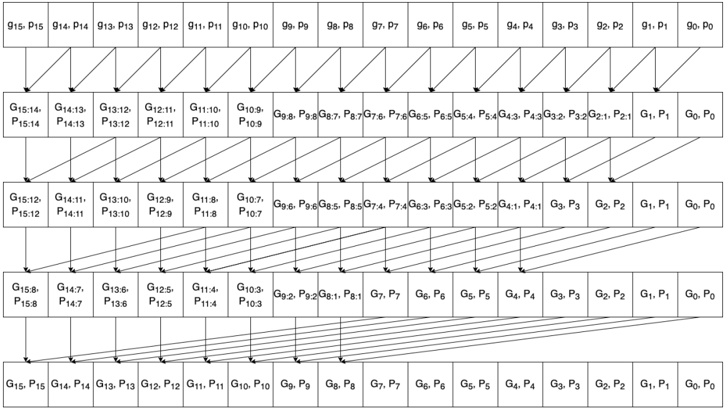
The image depicts a multi-row flowchart with labeled boxes and directional arrows. Each row contains a sequence of boxes labeled with alphanumeric codes (e.g., G15-P15, G14-P14) and arrows connecting them. The arrows are labeled with additional codes (e.g., G15.14, P15.14), suggesting transitions or relationships between stages. The diagram appears to represent a structured process or system with hierarchical or sequential dependencies.
### Components/Axes
- **Boxes**: Labeled with codes like `G15-P15`, `G14-P14`, `G13-P13`, etc. These likely represent distinct stages, components, or entities in the process.
- **Arrows**: Labeled with codes like `G15.14`, `P15.14`, `G14.13`, etc. These indicate directional flow or interactions between boxes.
- **Rows**: Organized into four distinct rows, each with a unique sequence of boxes and arrows.
- **Legend**: No explicit legend is present, but the labels on boxes and arrows serve as identifiers.
### Detailed Analysis
#### Row 1 (Top Row)
- **Boxes**: `G15-P15`, `G14-P14`, `G13-P13`, `G12-P12`, `G11-P11`, `G10-P10`, `G9-P9`, `G8-P8`, `G7-P7`, `G6-P6`, `G5-P5`, `G4-P4`, `G3-P3`, `G2-P2`, `G1-P1`, `G0-P0`.
- **Arrows**: Connect each box to the next in sequence (e.g., `G15-P15` → `G14-P14` → ... → `G0-P0`).
- **Labels on Arrows**: `G15.14`, `P15.14`, `G14.13`, `P14.13`, ..., `G0.1`, `P0.1`.
#### Row 2
- **Boxes**: `G15.14`, `G14.13`, `G13.12`, `G12.11`, `G11.10`, `G10.9`, `G9.8`, `G8.7`, `G7.6`, `G6.5`, `G5.4`, `G4.3`, `G3.2`, `G2.1`, `G1`, `P0`.
- **Arrows**: Connect boxes in sequence (e.g., `G15.14` → `G14.13` → ... → `P0`).
- **Labels on Arrows**: `G15.14`, `P15.14`, `G14.13`, `P14.13`, ..., `G0.1`, `P0.1`.
#### Row 3
- **Boxes**: `G15.12`, `G14.11`, `G13.10`, `G12.9`, `G11.8`, `G10.7`, `G9.6`, `G8.5`, `G7.4`, `G6.3`, `G5.2`, `G4.1`, `G3.3`, `G2.2`, `G1.1`, `P0`.
- **Arrows**: Connect boxes in sequence (e.g., `G15.12` → `G14.11` → ... → `P0`).
- **Labels on Arrows**: `G15.12`, `P15.12`, `G14.11`, `P14.11`, ..., `G0.1`, `P0.1`.
#### Row 4
- **Boxes**: `G15.8`, `G14.7`, `G13.6`, `G12.5`, `G11.4`, `G10.3`, `G9.2`, `G8.1`, `G7.7`, `G6.6`, `G5.5`, `G4.4`, `G3.3`, `G2.2`, `G1.1`, `P0`.
- **Arrows**: Connect boxes in sequence (e.g., `G15.8` → `G14.7` → ... → `P0`).
- **Labels on Arrows**: `G15.8`, `P15.8`, `G14.7`, `P14.7`, ..., `G0.1`, `P0.1`.
#### Row 5 (Bottom Row)
- **Boxes**: `G15`, `G14`, `G13`, `G12`, `G11`, `G10`, `G9`, `G8`, `G7`, `G6`, `G5`, `G4`, `G3`, `G2`, `G1`, `P0`.
- **Arrows**: Connect boxes in sequence (e.g., `G15` → `G14` → ... → `P0`).
- **Labels on Arrows**: `G15`, `P15`, `G14`, `P14`, ..., `G0.1`, `P0.1`.
### Key Observations
1. **Hierarchical Structure**: Each row represents a distinct level or phase of the process, with boxes labeled to reflect decreasing or increasing numerical values (e.g., `G15-P15` to `G0-P0`).
2. **Arrow Labels**: Arrows are labeled with codes that combine the source and target box codes (e.g., `G15.14` connects `G15-P15` to `G14-P14`).
3. **Repetition of Patterns**: The labels on boxes and arrows follow a consistent pattern, suggesting a systematic or algorithmic structure.
4. **Final Stage**: All rows converge on `P0`, indicating a terminal or output stage.
### Interpretation
The diagram likely represents a multi-stage process or system with hierarchical dependencies. The labels on boxes (e.g., `G15-P15`, `G14-P14`) may denote specific components, stages, or entities, while the arrows (e.g., `G15.14`, `P15.14`) indicate transitions or interactions between them. The convergence on `P0` suggests a final output or resolution point. The structured repetition across rows implies a modular or iterative design, possibly for a computational, engineering, or organizational workflow.
No numerical data or trends are present, as the diagram focuses on structural relationships rather than quantitative values. The absence of a legend or explicit axis titles limits direct interpretation of the labels, but their consistent formatting suggests a standardized coding system.