\n
## Diagram: Stair-Step Representation of Values
### Overview
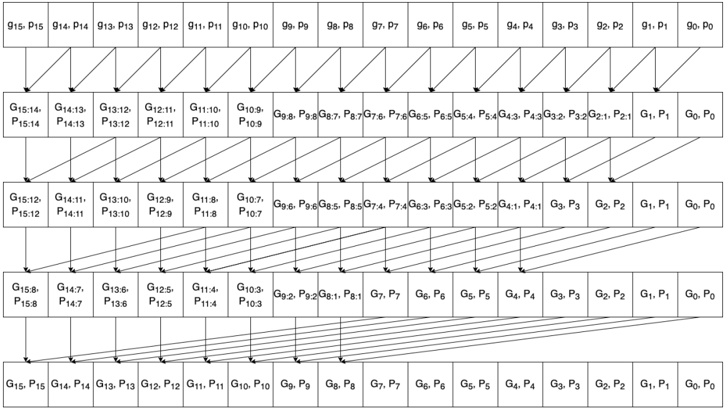
The image presents a diagram consisting of five horizontal bands, each containing a series of rectangular blocks. Each block is labeled with two values separated by a colon (e.g., G15:15). The diagram appears to represent a series of incremental steps or a cumulative distribution, with the values increasing from left to right and across the bands. The bands are stacked vertically, creating a stair-step effect.
### Components/Axes
The diagram does not have explicit axes in the traditional sense. However, the horizontal bands can be considered as representing different levels or stages. The blocks within each band represent individual data points. The labels within each block indicate a paired value, likely representing a category (prefixed with "G") and a corresponding numerical value (following the colon). The labels along the top row are G0 to G15, and the labels along the left side are P0 to P15.
### Detailed Analysis or Content Details
The diagram consists of five horizontal bands. Let's analyze each band:
* **Top Band:** The labels are G9 to G15, paired with values 9 to 15. The labels are G9:9, G10:10, G11:11, G12:12, G13:13, G14:14, G15:15.
* **Second Band:** The labels are G8 to G14, paired with values 7 to 14. The labels are G8:7, G9:8, G10:9, G11:10, G12:11, G13:12, G14:13, G15:14.
* **Third Band:** The labels are G7 to G13, paired with values 6 to 12. The labels are G7:6, G8:7, G9:8, G10:9, G11:10, G12:11, G13:12, G14:11, G15:12.
* **Fourth Band:** The labels are G6 to G12, paired with values 5 to 11. The labels are G6:5, G7:6, G8:7, G9:8, G10:9, G11:10, G12:11, G13:10, G14:11, G15:11.
* **Bottom Band:** The labels are G5 to G11, paired with values 4 to 10. The labels are G5:4, G6:5, G7:6, G8:7, G9:8, G10:9, G11:10, G12:9, G13:10, G14:9, G15:10.
Each band's blocks are connected by diagonal lines, creating the stair-step pattern. The lines connect each block to the corresponding block in the band above it.
### Key Observations
The diagram demonstrates a cumulative or incremental relationship between the "G" and numerical values. As you move from left to right within each band, both the "G" value and the numerical value increase. The stair-step pattern suggests that the numerical value increases by one for each step, but the "G" value shifts between bands. The diagram appears to represent a mapping or transformation between the "G" categories and their corresponding numerical values.
### Interpretation
The diagram likely represents a cumulative distribution or a mapping of categories to values. The "G" values could represent different groups or items, and the numerical values could represent their corresponding scores, quantities, or ranks. The stair-step pattern indicates that each "G" value is associated with a range of numerical values, and the diagram shows how these values accumulate across the different "G" categories.
The diagram could be used to visualize the distribution of scores or quantities across different groups, or to illustrate the relationship between categories and their corresponding values. The diagram's simplicity and clarity make it an effective way to communicate this information. The diagram is a visual representation of a function or a lookup table, where the input is a "G" value and the output is a corresponding numerical value. The stair-step pattern suggests that the function is piecewise linear, with constant slopes within each band.