## Scatter Plot: high_school_geography
### Overview
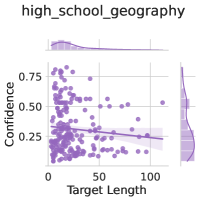
The image is a scatter plot titled "high_school_geography". It displays the relationship between "Target Length" on the x-axis and "Confidence" on the y-axis. The plot includes a regression line with a shaded confidence interval. Histograms are displayed along the top and right edges, showing the distributions of "Target Length" and "Confidence" respectively.
### Components/Axes
* **Title:** high_school_geography
* **X-axis:**
* Label: Target Length
* Scale: 0 to 100, with tick marks at 0, 50, and 100.
* **Y-axis:**
* Label: Confidence
* Scale: 0 to 0.75, with tick marks at 0, 0.25, 0.50, and 0.75.
* **Data Points:** Purple dots scattered across the plot.
* **Regression Line:** A purple line showing the linear trend of the data.
* **Confidence Interval:** A shaded purple region around the regression line, indicating the uncertainty in the line's position.
* **Histograms:**
* Top: Distribution of Target Length.
* Right: Distribution of Confidence.
### Detailed Analysis
* **Data Points:** The data points are concentrated towards the lower-left corner of the plot, indicating that most data points have low target lengths and low confidence values.
* **Regression Line:** The regression line has a slight negative slope, suggesting a weak negative correlation between Target Length and Confidence.
* **Confidence Interval:** The confidence interval widens towards the right side of the plot, indicating greater uncertainty in the regression line's position for higher target lengths.
* **Target Length Distribution:** The histogram at the top shows that the target lengths are skewed towards lower values, with a peak around 0-20.
* **Confidence Distribution:** The histogram on the right shows that the confidence values are somewhat bimodal, with peaks around 0.25 and 0.50.
### Key Observations
* There is a weak negative correlation between Target Length and Confidence.
* Most data points have low target lengths and low confidence values.
* The uncertainty in the regression line's position increases with target length.
* Target lengths are skewed towards lower values.
* Confidence values have a bimodal distribution.
### Interpretation
The scatter plot suggests that there is a slight tendency for confidence to decrease as target length increases in the context of high school geography. However, the correlation is weak, and there is considerable variability in the data. The concentration of data points at low target lengths and low confidence values suggests that shorter targets are generally associated with lower confidence. The bimodal distribution of confidence values may indicate the presence of two distinct groups of data points with different confidence levels. The widening confidence interval at higher target lengths suggests that the relationship between target length and confidence is less certain for longer targets.