\n
## Scatter Plot with Marginal Distributions: high_school_geography
### Overview
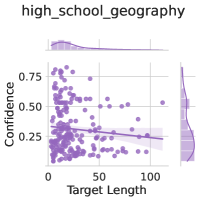
The image is a statistical visualization, specifically a scatter plot with marginal distribution plots (density curves) on the top and right sides. It displays the relationship between "Target Length" and "Confidence" for a dataset labeled "high_school_geography". The plot includes a fitted trend line and uses a monochromatic purple color scheme.
### Components/Axes
* **Title:** "high_school_geography" (centered at the top).
* **X-Axis:**
* **Label:** "Target Length"
* **Scale:** Linear, ranging from 0 to approximately 120.
* **Major Tick Marks:** 0, 50, 100.
* **Y-Axis:**
* **Label:** "Confidence"
* **Scale:** Linear, ranging from 0.00 to approximately 0.85.
* **Major Tick Marks:** 0.00, 0.25, 0.50, 0.75.
* **Legend:**
* **Placement:** Top-left corner of the main plot area.
* **Content:** A purple square symbol followed by the text "high_school_geography".
* **Data Series:**
* **Type:** Scatter plot (individual data points).
* **Color:** Purple (matching the legend).
* **Trend Line:** A solid, darker purple line showing a linear regression fit.
* **Marginal Plots:**
* **Top Marginal:** A density plot (smoothed histogram) showing the distribution of the "Target Length" variable. It is right-skewed, with the highest density near 0.
* **Right Marginal:** A density plot showing the distribution of the "Confidence" variable. It is also right-skewed, with the highest density near 0.00-0.10.
### Detailed Analysis
* **Data Point Distribution:** The purple data points are densely clustered in the lower-left quadrant of the plot. The highest concentration appears where "Target Length" is between 0 and 50 and "Confidence" is between 0.00 and 0.50.
* **Trend Line:** The regression line has a clear negative slope. It originates at approximately (Target Length=0, Confidence=0.35) and descends to approximately (Target Length=100, Confidence=0.20). This indicates a negative correlation between the two variables.
* **Marginal Distributions:**
* The **Target Length** distribution peaks sharply near 0 and has a long tail extending to the right, indicating most targets are short, with a few very long ones.
* The **Confidence** distribution peaks near 0.05 and declines steadily, indicating most predictions have low confidence scores.
* **Outliers:** There are a few scattered points with high Confidence (>0.75), primarily associated with shorter Target Lengths (<50). There are also points with very long Target Lengths (>100) that have low to moderate Confidence.
### Key Observations
1. **Negative Correlation:** The primary observation is the inverse relationship between Target Length and Confidence. As the length of the target increases, the model's confidence in its prediction tends to decrease.
2. **Data Skew:** Both variables are heavily right-skewed. The dataset is dominated by short targets and low-confidence predictions.
3. **High-Confidence Cluster:** The subset of predictions with high confidence (>0.75) is almost exclusively associated with shorter target lengths.
4. **Variance:** The scatter of points around the trend line is substantial, indicating that Target Length alone is not a perfect predictor of Confidence. There is significant variability in confidence for any given target length.
### Interpretation
This chart suggests that for the "high_school_geography" task or dataset, the model's confidence is negatively impacted by the length of the target it is trying to predict or generate. This is a common pattern in language and information tasks: longer, more complex outputs are harder to produce with high certainty.
The heavy skew in both distributions implies the evaluation set or task is composed mostly of short, simple targets, for which the model often has low confidence. The outliers with high confidence on short targets represent the model's "sweet spot." The presence of long targets with low confidence highlights a potential area for model improvement or indicates inherently difficult examples.
The marginal plots are crucial here. They confirm that the dense cluster of points in the lower-left isn't just a visual artifact; it reflects the fundamental composition of the underlying data. The investigation should focus on why confidence is generally low and why it degrades further with length. Is it a limitation of the model architecture, the quality of the training data for long targets, or an inherent property of the geography task itself?