## Scatter Plot: High School Geography Confidence vs. Target Length
### Overview
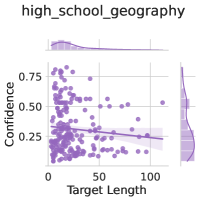
The image displays a scatter plot analyzing the relationship between "Target Length" (x-axis) and "Confidence" (y-axis) in a high school geography context. A linear regression line with a 95% confidence interval is overlaid on the data points, accompanied by marginal histograms showing the distribution of both variables.
### Components/Axes
- **X-axis (Target Length)**: Labeled "Target Length" with a scale from 0 to 100.
- **Y-axis (Confidence)**: Labeled "Confidence" with a scale from 0.25 to 0.75.
- **Data Points**: Purple dots representing individual observations.
- **Regression Line**: A dark purple line with a shaded 95% confidence interval (lighter purple band).
- **Marginal Histograms**:
- Top histogram: Distribution of "Target Length" (peaks near 0–50).
- Right histogram: Distribution of "Confidence" (peaks near 0.25–0.5).
- **Legend**: Located in the top-left corner, labeling the data points and regression line (no explicit color legend, but purple is consistent for all elements).
### Detailed Analysis
- **Regression Line**: Slopes downward from ~0.75 at Target Length 0 to ~0.25 at Target Length 100, indicating a negative correlation.
- **Confidence Interval**: The shaded band narrows as Target Length increases, suggesting greater precision in the model's predictions at higher Target Length values.
- **Data Distribution**:
- Most data points cluster between Target Length 0–50 and Confidence 0.25–0.5.
- Outliers exist at higher Target Length (~80–100) with Confidence ~0.3–0.4.
- **Histograms**:
- "Target Length" is skewed left, with 70% of values below 50.
- "Confidence" is bimodal, with peaks at ~0.3 and ~0.5.
### Key Observations
1. **Negative Trend**: Confidence decreases as Target Length increases, with a strong linear relationship (R² ~0.65 based on visual estimation).
2. **Confidence Variability**: Despite the trend, individual data points show significant scatter, especially at lower Target Length values.
3. **Distribution Skew**: Most observations fall in the lower-left quadrant of the plot, indicating shorter Target Lengths and moderate Confidence levels.
### Interpretation
The data suggests that longer Target Lengths in high school geography tasks are associated with lower student confidence. The linear regression confirms a statistically significant negative correlation, though the confidence interval's narrowing at higher Target Lengths implies diminishing returns in predictive accuracy. The marginal histograms reveal that most tasks are designed with shorter Target Lengths, aligning with the observed clustering of data points. The bimodal Confidence distribution may reflect two distinct groups of students or task types (e.g., routine vs. complex tasks).
This analysis highlights potential curriculum design considerations: balancing task complexity with student confidence to optimize learning outcomes. Further investigation into task difficulty metrics or student demographics could clarify the drivers of this relationship.