TECHNICAL ASSET FINGERPRINT
173584a69d66e816702a3376
Click to view fullscreen
Press ESC or click to close
FOUND IN PAPERS
EXPERT: gemini-2.0-flash VERSION 1
RUNTIME: nugit/gemini/gemini-2.0-flash
INTEL_VERIFIED
## Scatter Plot: t-SNE of MCP tools by Category
### Overview
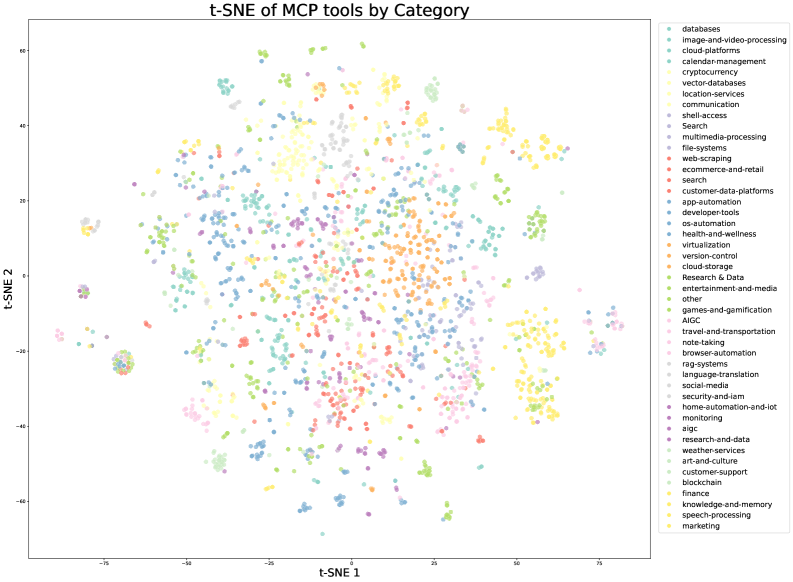
The image is a scatter plot visualizing the t-distributed Stochastic Neighbor Embedding (t-SNE) of MCP (likely "Managed Cloud Provider") tools, categorized by their function. The plot aims to reduce the dimensionality of the data, representing each tool as a point in a two-dimensional space (t-SNE 1 and t-SNE 2). Points are colored according to their category, as indicated by the legend on the right. The plot shows the relationships and groupings of different MCP tools based on their features.
### Components/Axes
* **Title:** "t-SNE of MCP tools by Category"
* **X-axis:** "t-SNE 1"
* Scale ranges approximately from -75 to 75, with labeled ticks at -50, -25, 0, 25, 50, and 75.
* **Y-axis:** "t-SNE 2"
* Scale ranges approximately from -60 to 60, with labeled ticks at -60, -40, -20, 0, 20, 40, and 60.
* **Legend:** Located on the right side of the plot, listing categories and their corresponding colors. The categories include:
* databases (light blue)
* image-and-video-processing (teal)
* cloud-platforms (light green)
* calendar-management (yellow)
* cryptocurrency (light yellow)
* vector-databases (pale yellow)
* location-services (orange)
* communication (dark grey)
* shell-access (light grey)
* Search (white)
* multimedia-processing (pink)
* file-systems (light red)
* web-scraping (red)
* ecommerce-and-retail (dark red)
* search (red-orange)
* customer-data-platforms (orange-red)
* app-automation (coral)
* developer-tools (green)
* os-automation (dark green)
* health-and-wellness (lime green)
* virtualization (forest green)
* version-control (olive green)
* cloud-storage (gold)
* Research & Data (light brown)
* entertainment-and-media (dark brown)
* other (grey-green)
* games-and-gamification (dark teal)
* AIGC (light purple)
* travel-and-transportation (lavender)
* note-taking (pale pink)
* browser-automation (light pink)
* rag-systems (violet)
* language-translation (purple)
* social-media (dark purple)
* security-and-iam (plum)
* home-automation-and-iot (dark violet)
* monitoring (magenta)
* aigc (dark magenta)
* research-and-data (light grey-green)
* weather-services (light olive)
* art-and-culture (dark olive)
* customer-support (dark yellow)
* blockchain (light brown-yellow)
* finance (brown)
* knowledge-and-memory (dark brown-yellow)
* speech-processing (light yellow-green)
* marketing (yellow)
### Detailed Analysis
The scatter plot shows the distribution of MCP tools in a two-dimensional space. The points are clustered, indicating that tools within the same category tend to have similar features. Some categories appear to be more tightly clustered than others.
* **Databases (light blue):** Located primarily in the top-left quadrant, with a dense cluster around (-50, 40).
* **Image-and-video-processing (teal):** Scattered across the top of the plot, with a concentration around (25, 50).
* **Cloud-platforms (light green):** Located in the top-right quadrant, with a cluster around (50, 50).
* **Calendar-management (yellow):** Located in the top-right quadrant, with a cluster around (50, 40).
* **Cryptocurrency (light yellow):** Located in the top-right quadrant, with a cluster around (50, 30).
* **Vector-databases (pale yellow):** Located in the top-right quadrant, with a cluster around (50, 20).
* **Location-services (orange):** Located in the center-right quadrant, with a cluster around (25, 0).
* **Communication (dark grey):** Located in the top-center quadrant, with a cluster around (0, 40).
* **Shell-access (light grey):** Located in the top-center quadrant, with a cluster around (0, 50).
* **Search (white):** Located in the top-center quadrant, with a cluster around (0, 60).
* **Multimedia-processing (pink):** Located in the center of the plot, with a cluster around (0, 20).
* **File-systems (light red):** Located in the center of the plot, with a cluster around (25, 20).
* **Web-scraping (red):** Located in the center of the plot, with a cluster around (25, 10).
* **Ecommerce-and-retail (dark red):** Located in the center of the plot, with a cluster around (25, 0).
* **search (red-orange):** Located in the center of the plot, with a cluster around (25, -10).
* **Customer-data-platforms (orange-red):** Located in the center of the plot, with a cluster around (0, -20).
* **App-automation (coral):** Located in the center of the plot, with a cluster around (0, -30).
* **Developer-tools (green):** Located in the bottom-center quadrant, with a cluster around (25, -40).
* **Os-automation (dark green):** Located in the bottom-center quadrant, with a cluster around (50, -40).
* **Health-and-wellness (lime green):** Located in the bottom-center quadrant, with a cluster around (50, -30).
* **Virtualization (forest green):** Located in the bottom-center quadrant, with a cluster around (50, -20).
* **Version-control (olive green):** Located in the bottom-center quadrant, with a cluster around (50, -10).
* **Cloud-storage (gold):** Located in the bottom-right quadrant, with a cluster around (50, 0).
* **Research & Data (light brown):** Located in the bottom-left quadrant, with a cluster around (-25, -40).
* **Entertainment-and-media (dark brown):** Located in the bottom-left quadrant, with a cluster around (-25, -30).
* **Other (grey-green):** Located in the bottom-left quadrant, with a cluster around (-25, -20).
* **Games-and-gamification (dark teal):** Located in the bottom-left quadrant, with a cluster around (-25, -10).
* **AIGC (light purple):** Located in the bottom-left quadrant, with a cluster around (-25, 0).
* **Travel-and-transportation (lavender):** Located in the bottom-left quadrant, with a cluster around (-25, 10).
* **Note-taking (pale pink):** Located in the bottom-left quadrant, with a cluster around (-25, 20).
* **Browser-automation (light pink):** Located in the bottom-left quadrant, with a cluster around (-25, 30).
* **Rag-systems (violet):** Located in the bottom-left quadrant, with a cluster around (-50, -20).
* **Language-translation (purple):** Located in the bottom-left quadrant, with a cluster around (-50, -10).
* **Social-media (dark purple):** Located in the bottom-left quadrant, with a cluster around (-50, 0).
* **Security-and-iam (plum):** Located in the bottom-left quadrant, with a cluster around (-50, 10).
* **Home-automation-and-iot (dark violet):** Located in the bottom-left quadrant, with a cluster around (-50, 20).
* **Monitoring (magenta):** Located in the bottom-left quadrant, with a cluster around (-50, 30).
* **aigc (dark magenta):** Located in the bottom-left quadrant, with a cluster around (-50, 40).
* **research-and-data (light grey-green):** Located in the bottom-left quadrant, with a cluster around (-50, 50).
* **Weather-services (light olive):** Located in the bottom-left quadrant, with a cluster around (-50, 60).
* **Art-and-culture (dark olive):** Located in the bottom-left quadrant, with a cluster around (-70, -20).
* **Customer-support (dark yellow):** Located in the bottom-left quadrant, with a cluster around (-70, -30).
* **Blockchain (light brown-yellow):** Located in the bottom-left quadrant, with a cluster around (-70, -40).
* **Finance (brown):** Located in the bottom-left quadrant, with a cluster around (-70, -50).
* **Knowledge-and-memory (dark brown-yellow):** Located in the bottom-left quadrant, with a cluster around (-70, -60).
* **Speech-processing (light yellow-green):** Located in the bottom-left quadrant, with a cluster around (-70, -70).
* **Marketing (yellow):** Located in the bottom-left quadrant, with a cluster around (-70, -80).
### Key Observations
* The t-SNE plot reveals clusters of MCP tools based on their categories.
* Some categories are more tightly clustered, suggesting a higher degree of similarity among the tools within those categories.
* The plot provides a visual representation of the relationships between different categories of MCP tools.
* The distribution of points is not uniform, indicating that some categories are more prevalent than others.
### Interpretation
The t-SNE plot provides a valuable visualization of the relationships between different MCP tools based on their categories. The clustering suggests that tools within the same category share similar features, while the relative positions of the clusters indicate the degree of similarity between different categories. This information can be used to gain insights into the competitive landscape of the MCP market, identify potential areas for innovation, and inform strategic decision-making. The plot also highlights the diversity of MCP tools available, with a wide range of categories represented. The non-uniform distribution of points suggests that some categories are more saturated than others, which could indicate opportunities for new entrants in less crowded areas.
DECODING INTELLIGENCE...