## Scatter Plot: t-SNE of MCP Tools by Category
### Overview
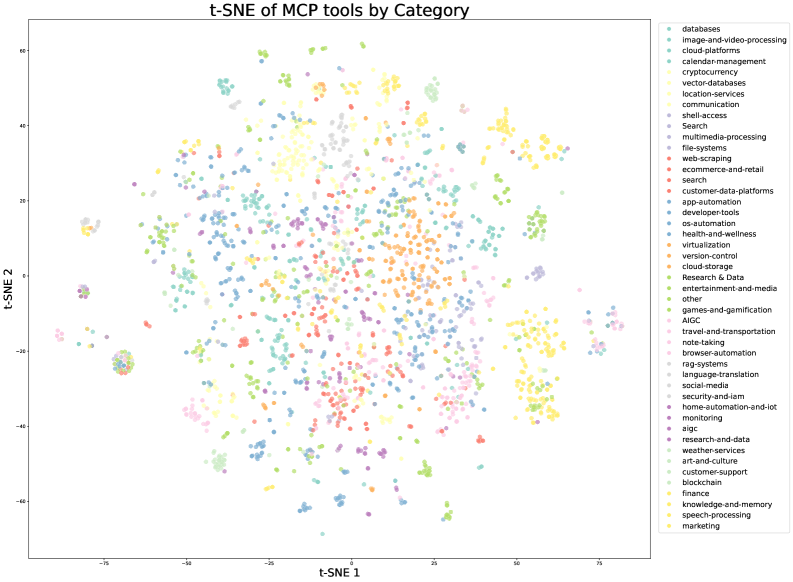
The image is a 2D t-SNE (t-distributed Stochastic Neighbor Embedding) visualization of Machine Control Platform (MCP) tools categorized by functionality. Points are colored by category, with a legend on the right. The plot reveals clustering patterns, indicating relationships between tool categories in a reduced-dimensional space.
### Components/Axes
- **X-axis**: Labeled "t-SNE 1" (horizontal), ranging approximately from -75 to 75.
- **Y-axis**: Labeled "t-SNE 2" (vertical), ranging approximately from -60 to 80.
- **Legend**: Located in the top-right corner, listing 40+ categories (e.g., "databases," "cloud-platforms," "finance") with distinct colors. Colors include light blue, dark blue, green, yellow, red, purple, pink, orange, and gray.
### Detailed Analysis
1. **Clustering Patterns**:
- **Central Cluster**: A dense mix of colors (e.g., yellow, green, blue) dominates the center, suggesting overlapping similarities between categories like "research-and-data," "developer-tools," and "cloud-storage."
- **Outliers**:
- **"Other" Category**: A small cluster in the bottom-left quadrant (t-SNE 1 ≈ -70, t-SNE 2 ≈ -50).
- **"Finance" Category**: A distinct cluster in the top-right quadrant (t-SNE 1 ≈ 60, t-SNE 2 ≈ 60).
- **"Image-and-Video-Processing"**: Scattered points in the upper-left quadrant (t-SNE 1 ≈ -50, t-SNE 2 ≈ 40).
- **Distinct Groups**:
- **"Search" and "Ecommerce-and-Retail"**: Clustered near the center (t-SNE 1 ≈ 0–20, t-SNE 2 ≈ -20 to 20).
- **"Blockchain" and "Cryptocurrency"**: Located in the upper-right quadrant (t-SNE 1 ≈ 40–50, t-SNE 2 ≈ 30–40).
2. **Color-Legend Consistency**:
- All legend colors match their corresponding data points. For example:
- "Databases" (light blue) appears in the lower-left quadrant.
- "Marketing" (yellow) is concentrated in the upper-right quadrant.
### Key Observations
- **Dominant Categories**: "Research-and-data" (yellow) and "developer-tools" (blue) form the largest central cluster.
- **Outliers**: "Other" and "Finance" are spatially isolated, indicating low similarity to other categories.
- **Overlap**: Categories like "cloud-platforms" (green) and "cloud-storage" (orange) are intermingled, suggesting functional overlap.
- **Sparse Regions**: The bottom-left quadrant has fewer points, indicating underrepresented categories.
### Interpretation
The t-SNE plot demonstrates that MCP tools with similar functionalities (e.g., "research-and-data" and "developer-tools") are grouped closely, while distinct categories like "Finance" and "Image-and-Video-Processing" occupy separate regions. The "Other" category’s isolation suggests it contains tools that do not align well with the primary functional groups. The central cluster’s diversity implies many tools share hybrid functionalities, reflecting the interdisciplinary nature of modern MCP ecosystems. Outliers like "Finance" highlight niche domains requiring specialized tooling. This visualization aids in identifying tool redundancies, gaps, and potential integration opportunities.