## Graph Diagrams: Two Example Graphs
### Overview
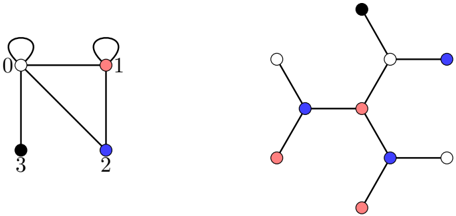
The image presents two separate graph diagrams. The first graph on the left is a smaller, more compact structure, while the second graph on the right is larger and more branched. Both graphs consist of nodes (vertices) connected by edges. The nodes are colored white, red, blue, or black.
### Components/Axes
* **Nodes (Vertices):** Represented by colored circles. Colors are white, red, blue, and black.
* **Edges:** Represented by black lines connecting the nodes.
* **Loops:** Present in the first graph, where an edge connects a node to itself.
* **Node Labels:** The first graph has nodes labeled 0, 1, 2, and 3.
### Detailed Analysis
**Left Graph:**
* Node 0 (white) has a self-loop and is connected to Node 1 (red), Node 2 (blue), and Node 3 (black).
* Node 1 (red) has a self-loop and is connected to Node 0 (white) and Node 2 (blue).
* Node 2 (blue) is connected to Node 0 (white) and Node 1 (red).
* Node 3 (black) is connected to Node 0 (white).
**Right Graph:**
* The central node is red.
* Connected to the central red node are two blue nodes and one white node.
* One blue node is connected to a red node and a red node.
* The other blue node is connected to a white node and a white node.
* The white node connected to the central red node is connected to a black node and a blue node.
* The blue node connected to the white node is connected to a white node.
### Key Observations
* The left graph is a simple, connected graph with loops.
* The right graph is a tree-like structure with a central node and branching connections.
* The node colors appear to be significant, potentially representing different properties or categories.
### Interpretation
The image presents two distinct graph structures, each with its own unique characteristics. The node colors and connectivity patterns likely encode specific information or relationships within the context of the application where these graphs are used. Without further context, it's difficult to determine the precise meaning of the colors or the significance of the graph structures. However, the presence of loops in the first graph and the tree-like structure of the second graph suggest different types of relationships or data representations.