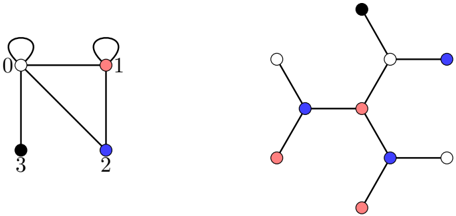
## Node-Link Diagrams: Two Graph Structures
### Overview
The image displays two separate, hand-drawn-style node-link diagrams (graphs) side-by-side on a white background. Both diagrams consist of circular nodes (vertices) connected by straight lines (edges). The nodes are colored in four distinct colors: white, red, blue, and black. The left diagram includes numerical labels for its nodes, while the right diagram does not.
### Components/Axes
**Left Diagram:**
* **Nodes:** 4 nodes, labeled with numbers 0, 1, 2, and 3.
* **Node Colors & Positions:**
* Node 0: White, positioned top-left.
* Node 1: Red, positioned top-right.
* Node 2: Blue, positioned bottom-right.
* Node 3: Black, positioned bottom-left.
* **Edges (Connections):**
* A loop (self-connection) on Node 0.
* A loop on Node 1.
* An edge between Node 0 and Node 1.
* An edge between Node 0 and Node 2.
* An edge between Node 0 and Node 3.
* An edge between Node 1 and Node 2.
**Right Diagram:**
* **Nodes:** 11 nodes total. No numerical or textual labels are present.
* **Node Colors & General Layout:** The graph has a central structure with branches extending outward.
* **Central Cluster:** A red node is connected to two blue nodes. One blue node is to its left, the other to its right and slightly down.
* **Upper Branch:** From the right-side blue node, an edge goes up to a white node. This white node connects further up to a black node and to the right to a blue node.
* **Lower-Right Branch:** From the right-side blue node, an edge goes down-right to another white node.
* **Lower-Left Branch:** From the left-side blue node, an edge goes down-left to a red node.
* **Far Lower Branch:** From the lower-right white node, an edge goes down to a final red node.
* **Edges:** All connections are simple, straight lines with no arrows, indicating undirected edges.
### Detailed Analysis
**Left Diagram Analysis:**
* **Trend/Structure:** This is a connected graph with a central hub (Node 0) connected to all other nodes. It contains two self-loops (on nodes 0 and 1) and forms a triangle between nodes 0, 1, and 2.
* **Node Degree (Number of Connections):**
* Node 0: Degree 5 (loop counts as 1, plus edges to 1, 2, 3).
* Node 1: Degree 3 (loop, plus edges to 0, 2).
* Node 2: Degree 2 (edges to 0, 1).
* Node 3: Degree 1 (edge to 0 only).
**Right Diagram Analysis:**
* **Trend/Structure:** This is a tree-like structure (no visible cycles) with a central red node acting as a primary junction. The graph branches out in multiple directions. The longest path appears to be from the top-most black node down to the bottom-most red node.
* **Color Distribution:** There are 3 red nodes, 3 blue nodes, 4 white nodes, and 1 black node.
### Key Observations
1. **Asymmetry:** Both graphs are asymmetric in their layout and connectivity.
2. **Color Coding:** Colors are used systematically to differentiate nodes but without an explicit legend. In the left graph, colors are paired with labels. In the right, color is the only identifier.
3. **Self-Loops:** Only the left diagram contains self-loops (edges from a node to itself).
4. **Complexity:** The right diagram is more complex, with a higher node count and a branching, non-linear structure compared to the more compact, hub-based left diagram.
5. **Spatial Grounding:** In the right diagram, the single black node is the highest (top-most) element. The lowest element is a red node at the bottom-center. The central red node is slightly right of the absolute center of its diagram.
### Interpretation
These diagrams likely represent abstract relational structures, such as **state machines, network topologies, or social graphs**.
* **Left Diagram:** Could model a system with four states (0-3). The loops on states 0 and 1 suggest these are "stable" or "idling" states. The high connectivity of Node 0 indicates it is a primary or master state. The triangle (0-1-2) suggests a tightly coupled subsystem.
* **Right Diagram:** Represents a hierarchical or branching network. The central red node is a critical connector or router. The color pattern might indicate node types or roles (e.g., red=router, blue=switch, white=client, black=external gateway). The tree structure suggests information or control flows from the central hub outwards to peripheral nodes.
* **Relationship Between Diagrams:** They are presented together for comparison, highlighting different graph topologies: a **small, dense, labeled graph with cycles** versus a **larger, sparse, unlabeled tree**. The use of the same color palette across both suggests a shared conceptual framework for classifying nodes, even if the specific meaning isn't provided. The absence of a legend is a significant omission for full technical interpretation.