## Diagram: Graphical Representation of Nodes and Connections
### Overview
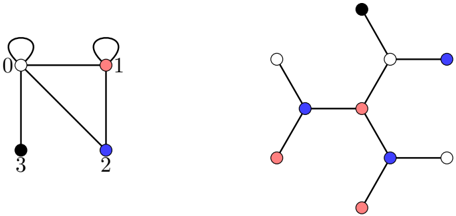
The image contains two distinct diagrams. The left diagram is a simple graph with labeled nodes and directional edges, while the right diagram is a more complex molecular or network structure with colored nodes and interconnected lines.
### Components/Axes
- **Left Diagram**:
- **Nodes**: Labeled with numbers `0`, `1`, `2`, `3`.
- **Colors**:
- Node `0`: White
- Node `1`: Red
- Node `2`: Blue
- Node `3`: Black
- **Edges**:
- `0` → `1` (horizontal)
- `0` → `3` (vertical)
- `1` → `2` (diagonal)
- `3` → `2` (diagonal)
- **No axis titles, legends, or scales present.**
- **Right Diagram**:
- **Nodes**: Colored but unlabeled (no numerical identifiers).
- **Colors**:
- Red
- Blue
- White
- Black
- **Edges**:
- Multiple interconnected lines forming a hexagonal or star-like pattern.
- **No axis titles, legends, or scales present.**
### Detailed Analysis
- **Left Diagram**:
- The graph is a directed acyclic graph (DAG) with four nodes.
- Node `0` is the central hub, connecting to `1`, `3`, and indirectly to `2` via `1` and `3`.
- Node `2` is a terminal node with two incoming edges.
- No numerical values or trends are present; the diagram focuses on connectivity.
- **Right Diagram**:
- The structure resembles a molecular or chemical network, with colored nodes representing atoms or components.
- Red and blue nodes are interconnected in a symmetrical pattern, suggesting a stable or balanced system.
- White and black nodes act as connectors or junctions.
- No numerical data or labels are provided, emphasizing structural relationships.
### Key Observations
- The left diagram is minimalistic, focusing on node labels and directional edges.
- The right diagram is more complex, with a focus on color-coded nodes and their spatial relationships.
- No numerical data, trends, or quantitative values are present in either diagram.
### Interpretation
- The left diagram likely represents a basic network or flow chart, where nodes `0` and `1` are primary sources, and `2` is a destination.
- The right diagram may symbolize a molecular structure, with colors indicating different elements or functional groups. The symmetry suggests a balanced or stable configuration.
- The absence of numerical data or legends implies the diagrams are conceptual or illustrative rather than data-driven.
- The use of color in both diagrams highlights categorical distinctions (e.g., node types, roles, or properties).
## Additional Notes
- **Language**: All text is in English.
- **No data tables, heatmaps, or numerical trends are present.**
- **Spatial grounding**: The left diagram is positioned on the left, and the right diagram on the right, with no overlapping elements.
- **Legend**: No explicit legend is provided; colors are directly embedded in the diagrams.