TECHNICAL ASSET FINGERPRINT
1743814a8cf397001a0a4fcb
Click to view fullscreen
Press ESC or click to close
FOUND IN PAPERS
EXPERT: healer-alpha-free VERSION 1
RUNTIME: free/openrouter/healer-alpha
INTEL_VERIFIED
## Grouped Bar Chart: LLM Performance Comparison Across CodeLogic Metrics
### Overview
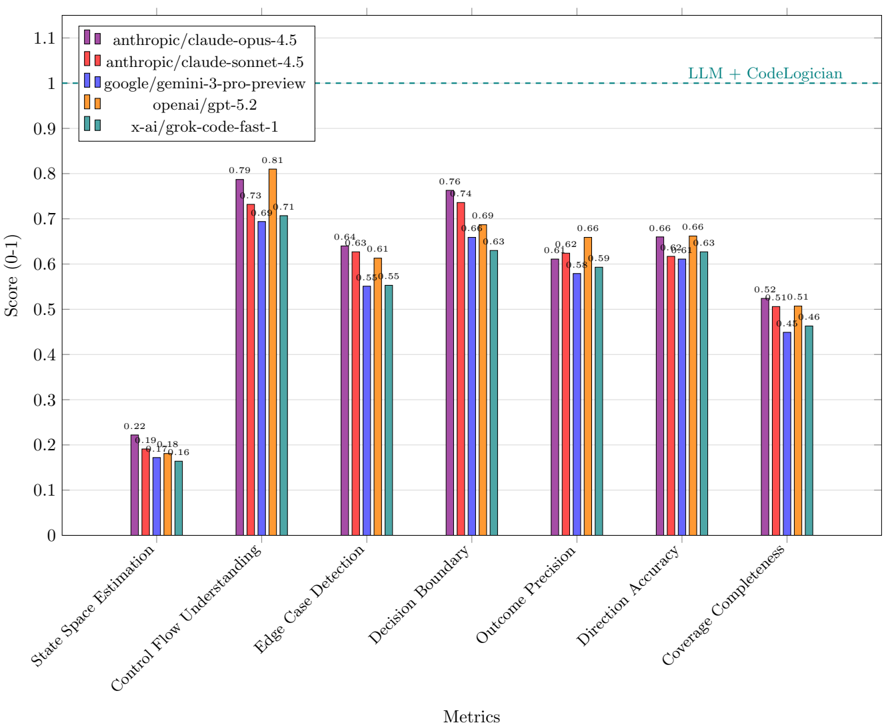
This image is a grouped bar chart comparing the performance of five different Large Language Models (LLMs) across seven distinct evaluation metrics. The chart visualizes scores on a scale from 0 to 1, with a horizontal dashed line indicating a theoretical maximum or benchmark labeled "LLM + CodeLogician."
### Components/Axes
* **Chart Type:** Grouped Bar Chart.
* **Y-Axis:** Labeled "Score (0-1)". The scale runs from 0.0 to 1.1, with major gridlines at intervals of 0.1.
* **X-Axis:** Labeled "Metrics". It contains seven categorical groups, each representing a different evaluation metric.
* **Legend:** Located in the top-left corner of the chart area. It maps colors to specific LLM models:
* Purple: `anthropic/claude-opus-4.5`
* Red: `anthropic/claude-sonnet-4.5`
* Blue: `google/gemini-3-pro-preview`
* Orange: `openai/gpt-5.2`
* Teal: `x-ai/grok-code-fast-1`
* **Benchmark Line:** A horizontal, dashed, teal-colored line at the Y-axis value of 1.0. It is labeled "LLM + CodeLogician" in the top-right corner of the chart area.
### Detailed Analysis
The chart presents scores for five models across seven metrics. The approximate values, read from the bar heights and their associated data labels, are as follows:
**1. State Space Estimation**
* Visual Trend: This metric shows the lowest scores across all models, with all bars below 0.25.
* Data Points:
* `anthropic/claude-opus-4.5` (Purple): 0.22
* `anthropic/claude-sonnet-4.5` (Red): 0.19
* `google/gemini-3-pro-preview` (Blue): 0.17
* `openai/gpt-5.2` (Orange): 0.18
* `x-ai/grok-code-fast-1` (Teal): 0.16
**2. Control Flow Understanding**
* Visual Trend: Scores are significantly higher than the first metric, ranging from ~0.7 to 0.8. The orange bar (`openai/gpt-5.2`) is the tallest.
* Data Points:
* `anthropic/claude-opus-4.5` (Purple): 0.79
* `anthropic/claude-sonnet-4.5` (Red): 0.73
* `google/gemini-3-pro-preview` (Blue): 0.69
* `openai/gpt-5.2` (Orange): 0.81
* `x-ai/grok-code-fast-1` (Teal): 0.71
**3. Edge Case Detection**
* Visual Trend: Scores cluster between 0.55 and 0.65. The purple and red bars are nearly equal and the highest.
* Data Points:
* `anthropic/claude-opus-4.5` (Purple): 0.64
* `anthropic/claude-sonnet-4.5` (Red): 0.63
* `google/gemini-3-pro-preview` (Blue): 0.55
* `openai/gpt-5.2` (Orange): 0.61
* `x-ai/grok-code-fast-1` (Teal): 0.55
**4. Decision Boundary**
* Visual Trend: Scores are relatively high, between 0.63 and 0.76. The purple bar is the tallest.
* Data Points:
* `anthropic/claude-opus-4.5` (Purple): 0.76
* `anthropic/claude-sonnet-4.5` (Red): 0.74
* `google/gemini-3-pro-preview` (Blue): 0.66
* `openai/gpt-5.2` (Orange): 0.69
* `x-ai/grok-code-fast-1` (Teal): 0.63
**5. Outcome Precision**
* Visual Trend: Scores range from 0.58 to 0.66. The orange bar is the tallest.
* Data Points:
* `anthropic/claude-opus-4.5` (Purple): 0.61
* `anthropic/claude-sonnet-4.5` (Red): 0.62
* `google/gemini-3-pro-preview` (Blue): 0.58
* `openai/gpt-5.2` (Orange): 0.66
* `x-ai/grok-code-fast-1` (Teal): 0.59
**6. Direction Accuracy**
* Visual Trend: Scores are tightly clustered between 0.62 and 0.66. The purple and orange bars are tied for the highest.
* Data Points:
* `anthropic/claude-opus-4.5` (Purple): 0.66
* `anthropic/claude-sonnet-4.5` (Red): 0.62
* `google/gemini-3-pro-preview` (Blue): 0.62
* `openai/gpt-5.2` (Orange): 0.66
* `x-ai/grok-code-fast-1` (Teal): 0.63
**7. Coverage Completeness**
* Visual Trend: This metric shows the second-lowest scores, ranging from 0.46 to 0.52.
* Data Points:
* `anthropic/claude-opus-4.5` (Purple): 0.52
* `anthropic/claude-sonnet-4.5` (Red): 0.51
* `google/gemini-3-pro-preview` (Blue): 0.45
* `openai/gpt-5.2` (Orange): 0.51
* `x-ai/grok-code-fast-1` (Teal): 0.46
### Key Observations
1. **Performance Hierarchy:** `anthropic/claude-opus-4.5` (Purple) and `openai/gpt-5.2` (Orange) are consistently the top performers, frequently trading the highest score in different metrics. `anthropic/claude-sonnet-4.5` (Red) is generally a close third.
2. **Metric Difficulty:** "State Space Estimation" is by far the most challenging metric for all models, with scores an order of magnitude lower than others. "Coverage Completeness" is the second most difficult.
3. **Model Consistency:** `google/gemini-3-pro-preview` (Blue) and `x-ai/grok-code-fast-1` (Teal) tend to score lower than the Anthropic and OpenAI models across most metrics, though they are competitive in specific areas like "Edge Case Detection" and "Direction Accuracy."
4. **Benchmark Gap:** All models score well below the "LLM + CodeLogician" benchmark line at 1.0 across every metric, indicating significant room for improvement to reach that theoretical performance level.
### Interpretation
The data suggests a comparative analysis of LLM capabilities in code-related logical reasoning tasks. The seven metrics likely evaluate different facets of program understanding and synthesis.
* **Core Strengths:** The leading models (`claude-opus-4.5`, `gpt-5.2`) demonstrate strong, but not perfect, understanding of control flow and decision boundaries—fundamental aspects of program logic.
* **Key Weaknesses:** The uniformly low scores in "State Space Estimation" point to a common, significant challenge for current LLMs: reasoning about the complete set of possible states a program can enter. Similarly, "Coverage Completeness" scores suggest difficulty in ensuring all code paths or conditions are addressed.
* **Practical Implication:** The chart implies that while advanced LLMs are proficient at many code logic tasks, they are not yet reliable for fully automated, high-assurance code analysis or generation where exhaustive state exploration and completeness are critical. The "LLM + CodeLogician" line may represent a target for a hybrid system combining an LLM with a formal logic or static analysis tool to bridge this gap.
* **Model Selection:** The choice between the top models may depend on the specific task. For instance, `gpt-5.2` has a slight edge in "Control Flow Understanding" and "Outcome Precision," while `claude-opus-4.5` leads in "Decision Boundary" and ties for the lead in "Direction Accuracy."
DECODING INTELLIGENCE...