## Bar Chart: Benchmark Comparison
### Overview
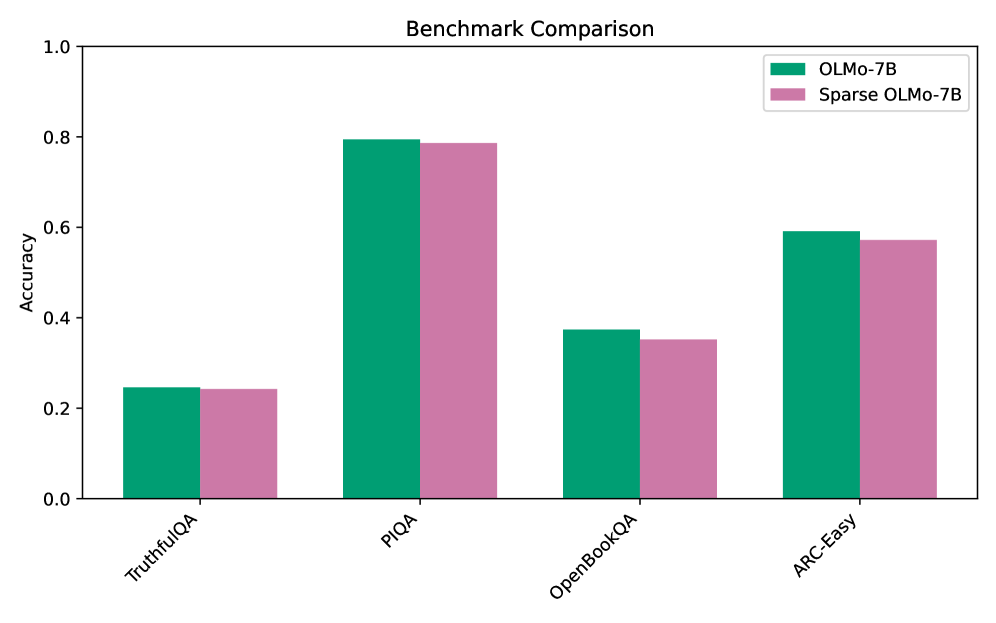
This image is a grouped bar chart titled "Benchmark Comparison." It compares the accuracy of two different language models—a base model and a sparse version of that model—across four distinct evaluation benchmarks.
### Components/Axes
**Header Region:**
* **Title:** "Benchmark Comparison" (Centered at the top).
**Legend Region:**
* **Placement:** Top-right corner, inside the main chart area.
* **Items:**
* Solid Teal/Green square: Labeled "OLMo-7B"
* Solid Pink/Mauve square: Labeled "Sparse OLMo-7B"
**Main Chart Axes:**
* **Y-Axis (Left side):**
* **Title:** "Accuracy" (Rotated 90 degrees counter-clockwise).
* **Scale:** Ranges from 0.0 to 1.0.
* **Markers/Ticks:** 0.0, 0.2, 0.4, 0.6, 0.8, 1.0.
* **X-Axis (Bottom):**
* **Title:** None explicitly stated, but represents evaluation benchmarks.
* **Categories (Left to Right):** The labels are rotated approximately 45 degrees clockwise to fit.
1. TruthfulQA
2. PIQA
3. OpenBookQA
4. ARC-Easy
### Detailed Analysis
**Trend Verification & Value Extraction:**
For every category on the X-axis, there is a pair of bars. In every single instance, the Teal bar (OLMo-7B) is visually slightly taller than the Pink bar (Sparse OLMo-7B).
* **TruthfulQA:**
* *Visual Trend:* Both bars are the lowest on the chart, sitting slightly above the 0.2 line. The teal bar is marginally higher.
* *OLMo-7B (Teal):* ~0.25
* *Sparse OLMo-7B (Pink):* ~0.24
* **PIQA:**
* *Visual Trend:* Both bars are the highest on the chart, reaching just below the 0.8 line. The teal bar is marginally higher.
* *OLMo-7B (Teal):* ~0.79
* *Sparse OLMo-7B (Pink):* ~0.78
* **OpenBookQA:**
* *Visual Trend:* Both bars sit below the halfway mark (0.5), just under the 0.4 line. The teal bar is visibly higher than the pink bar.
* *OLMo-7B (Teal):* ~0.38
* *Sparse OLMo-7B (Pink):* ~0.35
* **ARC-Easy:**
* *Visual Trend:* Both bars sit just below the 0.6 line. The teal bar is marginally higher.
* *OLMo-7B (Teal):* ~0.59
* *Sparse OLMo-7B (Pink):* ~0.57
**Reconstructed Data Table (Approximate Values ±0.02):**
| Benchmark | OLMo-7B (Accuracy) | Sparse OLMo-7B (Accuracy) |
| :--- | :--- | :--- |
| TruthfulQA | ~0.25 | ~0.24 |
| PIQA | ~0.79 | ~0.78 |
| OpenBookQA | ~0.38 | ~0.35 |
| ARC-Easy | ~0.59 | ~0.57 |
### Key Observations
1. **Consistent Dominance:** The dense model (OLMo-7B) consistently outperforms the sparse model (Sparse OLMo-7B) across all four benchmarks.
2. **Minimal Degradation:** The difference in accuracy between the dense and sparse models is very small (roughly 0.01 to 0.03 points) across all tasks.
3. **Task Difficulty Variance:** The models perform vastly differently depending on the task. PIQA yields the highest accuracy (~0.80), while TruthfulQA yields the lowest (~0.25).
### Interpretation
The data demonstrates the performance impact of applying "sparsity" to the OLMo-7B large language model. Sparsity in neural networks usually involves removing less important weights or parameters to make the model faster or less computationally expensive to run.
The critical takeaway from this chart is that **sparsifying the OLMo-7B model results in a negligible loss of accuracy.** While the dense model strictly performs better, the penalty for using the sparse model is incredibly small across a variety of reasoning and knowledge tasks (TruthfulQA, PIQA, OpenBookQA, ARC-Easy).
Furthermore, the chart highlights the inherent difficulty of the benchmarks themselves. Both models struggle significantly with `TruthfulQA` (scoring around 25%, which is often near random chance depending on the multiple-choice format), indicating this is a complex task for 7-billion parameter models. Conversely, `PIQA` (Physical Interaction: Question Answering) is relatively easy for these models, with both nearing 80% accuracy.
Ultimately, this chart would likely be used in a technical paper or presentation to argue that "Sparse OLMo-7B" is a highly viable, efficient alternative to the base model, offering comparable performance with presumed computational benefits.