## Bar Chart: Benchmark Comparison
### Overview
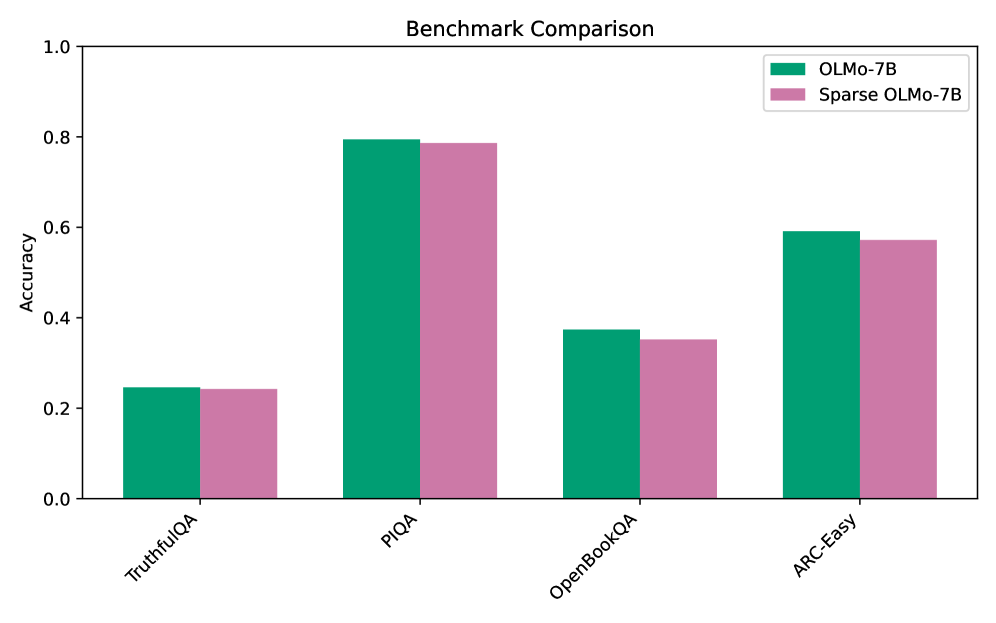
The image is a bar chart comparing the accuracy of two models, OLMo-7B and Sparse OLMo-7B, across four different benchmarks: TruthfulQA, PIQA, OpenBookQA, and ARC-Easy. The y-axis represents accuracy, ranging from 0.0 to 1.0. The x-axis represents the benchmark categories.
### Components/Axes
* **Title:** Benchmark Comparison
* **Y-axis:**
* Label: Accuracy
* Scale: 0.0 to 1.0, with increments of 0.2 (0.0, 0.2, 0.4, 0.6, 0.8, 1.0)
* **X-axis:**
* Categories: TruthfulQA, PIQA, OpenBookQA, ARC-Easy
* **Legend:** Located in the top-right corner.
* OLMo-7B (Green)
* Sparse OLMo-7B (Pink)
### Detailed Analysis
Here's a breakdown of the accuracy for each model on each benchmark:
* **TruthfulQA:**
* OLMo-7B (Green): Approximately 0.25
* Sparse OLMo-7B (Pink): Approximately 0.24
* **PIQA:**
* OLMo-7B (Green): Approximately 0.80
* Sparse OLMo-7B (Pink): Approximately 0.79
* **OpenBookQA:**
* OLMo-7B (Green): Approximately 0.37
* Sparse OLMo-7B (Pink): Approximately 0.35
* **ARC-Easy:**
* OLMo-7B (Green): Approximately 0.60
* Sparse OLMo-7B (Pink): Approximately 0.57
### Key Observations
* OLMo-7B consistently performs slightly better than Sparse OLMo-7B across all benchmarks.
* Both models achieve the highest accuracy on the PIQA benchmark.
* Both models perform the worst on the TruthfulQA benchmark.
* The difference in accuracy between OLMo-7B and Sparse OLMo-7B is relatively small for all benchmarks.
### Interpretation
The bar chart provides a direct comparison of the performance of OLMo-7B and its sparse variant on different question-answering benchmarks. The data suggests that while sparsity might offer benefits in terms of model size or computational efficiency, it comes at a slight cost in accuracy. The PIQA benchmark appears to be the easiest for both models, while TruthfulQA poses the greatest challenge. The relatively small differences in accuracy between the two models suggest that the sparse version retains most of the performance of the original model.