## Line Chart: Mean Firing Rate vs. Epoch
### Overview
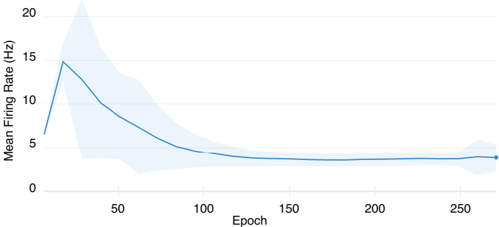
The image is a line chart showing the relationship between the mean firing rate (in Hz) and the epoch number. The chart displays a single data series with a shaded area around the line, presumably representing the standard deviation or confidence interval. The firing rate initially increases, then decreases rapidly before stabilizing at a lower level.
### Components/Axes
* **X-axis:** Epoch, with tick marks at approximately 50, 100, 150, 200, and 250.
* **Y-axis:** Mean Firing Rate (Hz), with tick marks at 0, 5, 10, 15, and 20.
* **Data Series:** A single blue line representing the mean firing rate. A light blue shaded area surrounds the line, indicating variability.
* **Legend:** There is no explicit legend, but the single line is understood to represent the "Mean Firing Rate."
### Detailed Analysis
* **Data Series Trend:** The blue line starts at approximately 6 Hz, rises to a peak of around 14.5 Hz, then rapidly declines to approximately 3 Hz, where it stabilizes and fluctuates slightly.
* **Data Points:**
* Epoch 0: Approximately 6 Hz
* Epoch 25: Approximately 14.5 Hz
* Epoch 50: Approximately 9.5 Hz
* Epoch 75: Approximately 6 Hz
* Epoch 100: Approximately 4 Hz
* Epoch 150: Approximately 3 Hz
* Epoch 200: Approximately 3 Hz
* Epoch 250: Approximately 3 Hz
* Epoch 275: Approximately 3.5 Hz
* **Shaded Area:** The light blue shaded area is widest at the beginning of the chart (around Epoch 0-50), indicating higher variability in the firing rate during the initial epochs. The shaded area narrows as the epoch number increases, suggesting that the firing rate becomes more stable over time.
### Key Observations
* The firing rate peaks early in the process (around Epoch 25) and then decreases significantly.
* The firing rate stabilizes after approximately 100 epochs.
* The variability in the firing rate is higher during the initial epochs.
### Interpretation
The chart suggests that the system or process being measured experiences an initial burst of activity (high firing rate) that then settles down to a more stable, lower level. The higher variability in the early epochs could indicate a period of learning, adaptation, or instability before the system reaches a steady state. The data demonstrates a clear trend of decreasing firing rate over time, with a stabilization point around epoch 100. This could represent a biological process, a machine learning algorithm converging, or any system that exhibits an initial surge followed by a period of consolidation.