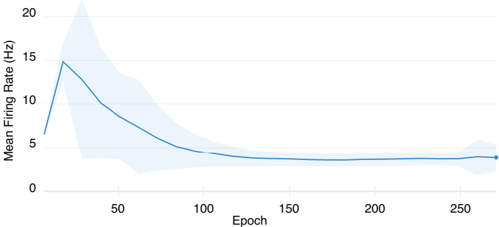
## Line Graph: Mean Firing Rate Over Epochs
### Overview
The image depicts a line graph illustrating the relationship between "Epoch" (training iterations) and "Mean Firing Rate (Hz)" over time. The graph shows a sharp initial peak followed by a gradual decline and stabilization, with a shaded confidence interval surrounding the central trend line.
### Components/Axes
- **X-axis (Epoch)**: Ranges from 0 to 250, labeled "Epoch" with no explicit units.
- **Y-axis (Mean Firing Rate)**: Labeled "Mean Firing Rate (Hz)" with values from 0 to 20 Hz.
- **Legend**: No explicit legend is visible, but the line and shaded area are both rendered in blue.
- **Line**: A single blue line represents the central trend.
- **Shaded Area**: A light blue band around the line, likely representing a confidence interval or variability.
### Detailed Analysis
1. **Initial Peak**:
- At ~50 epochs, the mean firing rate peaks at approximately **15 Hz**.
- The shaded area here is widest, indicating high variability.
2. **Decline Phase**:
- From 50 to ~150 epochs, the firing rate decreases steadily, reaching ~5 Hz by 150 epochs.
- The shaded area narrows slightly, suggesting reduced variability.
3. **Stabilization Phase**:
- From 150 to 250 epochs, the firing rate stabilizes between **3–4 Hz**.
- The shaded area remains narrow, indicating consistent performance.
### Key Observations
- The firing rate exhibits a **bell-shaped curve** with a sharp ascent and gradual descent.
- The shaded area’s width correlates with the line’s steepness: wider during rapid changes (early epochs) and narrower during stabilization.
- No outliers or anomalies are visible; the trend is smooth and monotonic after the initial peak.
### Interpretation
The graph suggests a **training or adaptation process** where initial high firing rates (possibly due to overfitting or instability) decrease as the system stabilizes. The narrowing confidence interval implies increasing certainty in the model’s performance over time. The stabilization at ~3–4 Hz may represent an optimal or equilibrium state. The absence of a legend limits direct interpretation of the shaded area’s exact meaning, but its correlation with the line’s trend suggests it reflects measurement uncertainty or model variance.