## Line Chart: pass@1-with-n-queries
### Overview
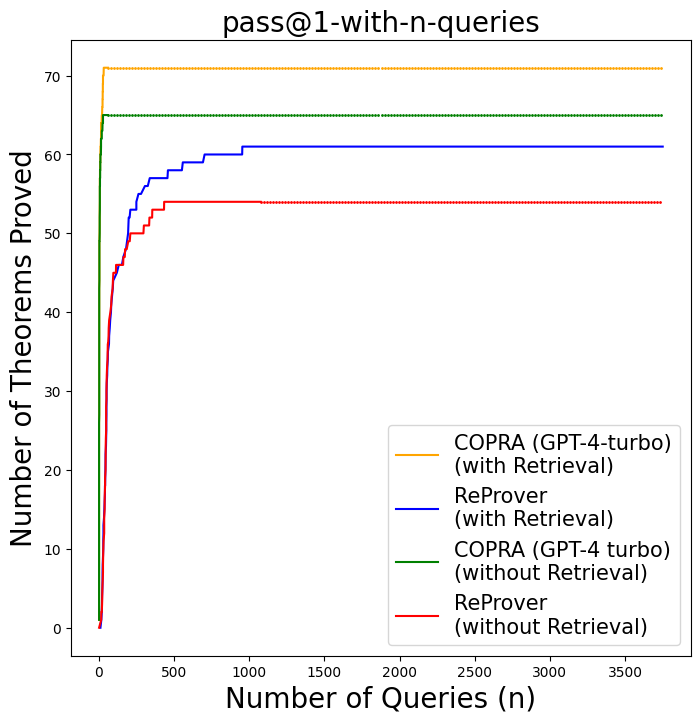
The image is a line chart comparing the performance of two theorem proving systems, COPRA (using GPT-4-turbo) and ReProver, with and without retrieval, based on the number of theorems proved as the number of queries increases. The x-axis represents the number of queries (n), ranging from 0 to 3500, and the y-axis represents the number of theorems proved, ranging from 0 to 70.
### Components/Axes
* **Title:** pass@1-with-n-queries
* **X-axis:**
* Label: Number of Queries (n)
* Scale: 0 to 3500, with major ticks at 0, 500, 1000, 1500, 2000, 2500, 3000, and 3500.
* **Y-axis:**
* Label: Number of Theorems Proved
* Scale: 0 to 70, with major ticks at 0, 10, 20, 30, 40, 50, 60, and 70.
* **Legend:** Located in the bottom-right corner of the chart.
* **Yellow:** COPRA (GPT-4-turbo) (with Retrieval)
* **Dark Blue:** ReProver (with Retrieval)
* **Green:** COPRA (GPT-4 turbo) (without Retrieval)
* **Red:** ReProver (without Retrieval)
### Detailed Analysis
* **COPRA (GPT-4-turbo) (with Retrieval) - Yellow Line:**
* Trend: The line rises sharply at the beginning and then plateaus at approximately 71.
* Data Points: Starts near 0, quickly rises, and stabilizes around 71.
* **ReProver (with Retrieval) - Dark Blue Line:**
* Trend: The line rises in steps, indicating incremental improvements as the number of queries increases, and plateaus around 61.
* Data Points: Starts near 0, rises to approximately 57 by query 250, then increases in steps to around 61, and remains stable.
* **COPRA (GPT-4 turbo) (without Retrieval) - Green Line:**
* Trend: The line rises sharply at the beginning and then plateaus at approximately 65.
* Data Points: Starts near 0, quickly rises to approximately 65, and remains stable.
* **ReProver (without Retrieval) - Red Line:**
* Trend: The line rises sharply at the beginning and then plateaus at approximately 54.
* Data Points: Starts near 0, rises to approximately 50 by query 250, then increases to around 54, and remains stable.
### Key Observations
* COPRA (GPT-4-turbo) with retrieval (yellow line) achieves the highest number of theorems proved, followed by COPRA without retrieval (green line).
* ReProver with retrieval (dark blue line) performs better than ReProver without retrieval (red line).
* All lines show a rapid initial increase in the number of theorems proved, followed by a plateau, indicating diminishing returns as the number of queries increases.
### Interpretation
The data suggests that using COPRA (GPT-4-turbo) with retrieval is the most effective approach for theorem proving in this context. The retrieval mechanism appears to significantly enhance the performance of both COPRA and ReProver. The plateauing of the lines indicates that there is a limit to the number of theorems that can be proved with these systems, regardless of the number of queries. The difference between the "with retrieval" and "without retrieval" lines highlights the importance of the retrieval component in improving the performance of these theorem proving systems.