## Scatter Plot: Model Size vs. PPL Performance
### Overview
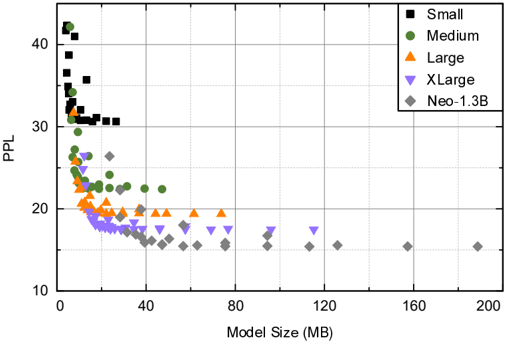
The image is a scatter plot comparing model sizes (in MB) to their perplexity (PPL) scores. Different marker shapes and colors represent distinct model categories (Small, Medium, Large, XLarge, Neo-1.3B). The x-axis spans 0–200 MB, and the y-axis ranges from 10 to 40 PPL. Data points are distributed across the plot, with clear trends in performance relative to model size.
### Components/Axes
- **X-axis**: Model Size (MB), labeled with increments at 0, 40, 80, 120, 160, and 200.
- **Y-axis**: PPL (Perplexity), labeled with increments at 10, 20, 30, and 40.
- **Legend**: Located in the top-right corner, mapping colors/shapes to categories:
- **Black squares**: Small
- **Green circles**: Medium
- **Orange triangles**: Large
- **Purple inverted triangles**: XLarge
- **Gray diamonds**: Neo-1.3B
### Detailed Analysis
1. **Small Models (Black Squares)**:
- **Range**: 0–40 MB (model size), 30–40 PPL.
- **Trend**: Clustered tightly in the top-left quadrant, indicating high PPL for smaller models.
2. **Medium Models (Green Circles)**:
- **Range**: 20–40 MB (model size), 20–30 PPL.
- **Trend**: Overlap with Small models but slightly lower PPL, suggesting marginal improvement.
3. **Large Models (Orange Triangles)**:
- **Range**: 40–80 MB (model size), 15–25 PPL.
- **Trend**: Lower PPL than Medium/Small, with a gradual decline as size increases.
4. **XLarge Models (Purple Inverted Triangles)**:
- **Range**: 60–120 MB (model size), 15–20 PPL.
- **Trend**: Further reduction in PPL, with a plateau around 15–20 PPL for larger sizes.
5. **Neo-1.3B (Gray Diamonds)**:
- **Range**: 80–200 MB (model size), 10–15 PPL.
- **Trend**: Dominates the lower-right quadrant, showing the lowest PPL across all sizes.
### Key Observations
- **Inverse Relationship**: Larger models consistently exhibit lower PPL, indicating improved performance.
- **Neo-1.3B Dominance**: This category achieves the lowest PPL (10–15) despite being the largest (80–200 MB).
- **Small Model Inefficiency**: Small models (0–40 MB) have the highest PPL (30–40), suggesting poor performance relative to size.
- **Diminishing Returns**: While increasing size reduces PPL, the rate of improvement slows for XLarge and Neo-1.3B models.
### Interpretation
The data demonstrates a clear trade-off between model size and performance. Larger models (e.g., Neo-1.3B) achieve significantly lower PPL, implying better generalization or accuracy. However, the diminishing returns for XLarge and Neo-1.3B suggest that beyond a certain size, additional computational resources yield minimal performance gains. Small and Medium models, while more efficient in terms of size, underperform compared to their larger counterparts. This trend aligns with common machine learning principles, where model complexity often correlates with improved task performance, albeit with practical limits due to resource constraints.