## Chart/Diagram Type: Comparative Visualization of 3D Gaussian Splatting Methods
### Overview
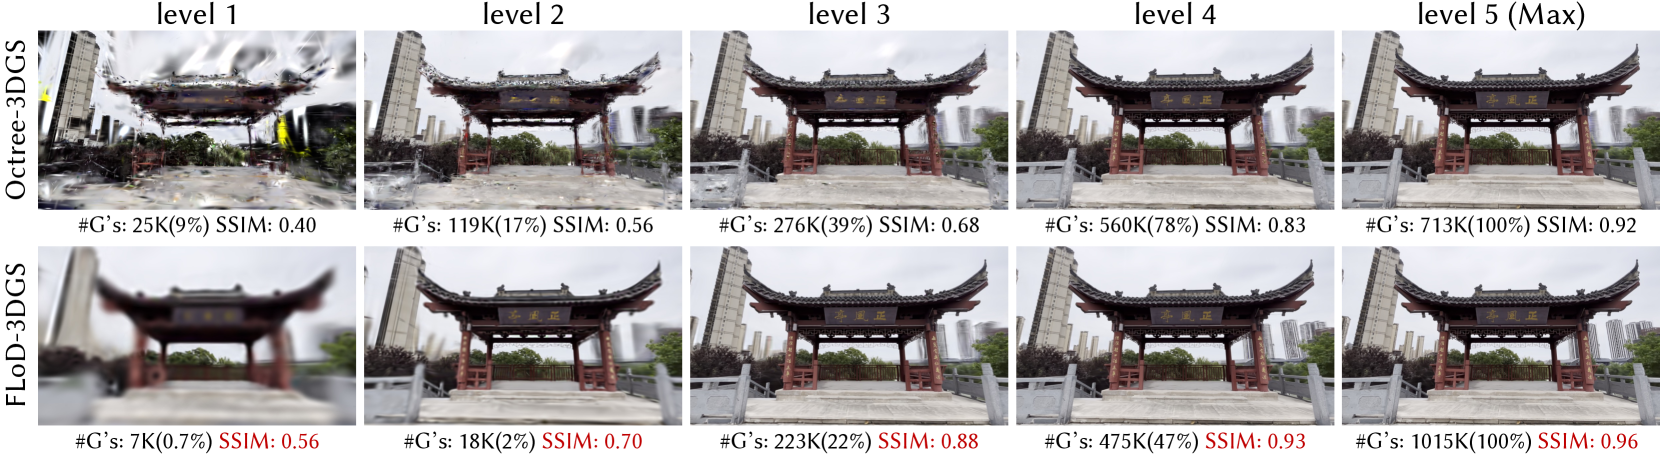
The image compares two 3D Gaussian Splatting (3DGS) methods, **Octree-3DGS** and **FLoD-3DGS**, across five progressive levels (1 to 5). Each level displays rendered images of a traditional Chinese pavilion structure, accompanied by quantitative metrics:
- **#G's**: Number of Gaussians used (with percentage of total Gaussians).
- **SSIM**: Structural Similarity Index Measure (ranging 0.0–1.0).
The comparison emphasizes trade-offs between computational efficiency (#G's) and image quality (SSIM) at increasing levels of detail.
---
### Components/Axes
- **X-axis**: Levels (1 to 5), labeled as "level 1", "level 2", ..., "level 5 (Max)".
- **Y-axis**: Methods, with two rows:
- **Top row**: Octree-3DGS (red SSIM annotations).
- **Bottom row**: FLoD-3DGS (green SSIM annotations).
- **Legend**: Implicit via color coding:
- **Red**: Octree-3DGS (lower SSIM, higher #G's).
- **Green**: FLoD-3DGS (higher SSIM, lower #G's).
---
### Detailed Analysis
#### Octree-3DGS (Top Row)
| Level | #G's (Total %) | SSIM |
|-------|----------------|------|
| 1 | 25K (9%) | 0.40 |
| 2 | 119K (17%) | 0.56 |
| 3 | 276K (39%) | 0.68 |
| 4 | 560K (78%) | 0.83 |
| 5 | 713K (100%) | 0.92 |
#### FLoD-3DGS (Bottom Row)
| Level | #G's (Total %) | SSIM |
|-------|----------------|------|
| 1 | 7K (0.7%) | 0.56 |
| 2 | 18K (2%) | 0.70 |
| 3 | 223K (22%) | 0.88 |
| 4 | 475K (47%) | 0.93 |
| 5 | 1015K (100%) | 0.96 |
---
### Key Observations
1. **SSIM Trends**:
- Both methods show **increasing SSIM** with higher levels, indicating improved image quality.
- FLoD-3DGS consistently outperforms Octree-3DGS at all levels (e.g., SSIM 0.96 vs. 0.92 at level 5).
2. **#G's Trends**:
- Octree-3DGS requires **significantly more Gaussians** to achieve comparable quality (e.g., 713K vs. 1015K at level 5).
- FLoD-3DGS achieves **higher SSIM with fewer Gaussians** (e.g., 0.70 SSIM at level 2 with only 18K Gaussians).
3. **Efficiency Gap**:
- At level 5, FLoD-3DGS uses **30% fewer Gaussians** (1015K vs. 713K) while achieving **4% higher SSIM** (0.96 vs. 0.92).
4. **Visual Quality**:
- Higher levels show sharper details (e.g., pavilion textures, background buildings) but introduce artifacts like over-smoothing (Octree-3DGS level 5) or blurring (FLoD-3DGS level 1).
---
### Interpretation
- **FLoD-3DGS** demonstrates superior efficiency and quality, suggesting it is better suited for applications requiring high-fidelity 3D rendering with limited computational resources.
- **Octree-3DGS** may be preferable in scenarios where maximum detail is prioritized over efficiency, though its scalability is constrained by the exponential growth in #G's.
- The **SSIM plateau** at level 5 for both methods (0.92–0.96) implies diminishing returns in perceptual quality beyond this point.
### Spatial Grounding & Validation
- SSIM annotations are positioned **bottom-left** of each image, with colors matching the method’s row (red/green).
- #G's annotations are placed **bottom-center**, with percentages in parentheses.
- All values align with the legend’s color coding, confirming consistency.
### Component Isolation
- **Header**: Level labels (top-center).
- **Main Chart**: Grid of images with dual-axis annotations (#G's and SSIM).
- **Footer**: Method labels (Octree-3DGS/FLoD-3DGS) and implicit legend.
### Content Details
- **Language**: English (annotations) and Chinese (pavilion signage in images).
- **Notable Outliers**:
- Octree-3DGS level 1 has the lowest SSIM (0.40) and highest #G's (25K) relative to quality.
- FLoD-3DGS level 5 achieves the highest SSIM (0.96) with the fewest Gaussians (1015K).
---
This visualization underscores the trade-off between computational cost and rendering quality in 3DGS methods, with FLoD-3DGS emerging as the more efficient and effective approach.