## Line Chart: Accuracy vs. Lambda for Different K Values
### Overview
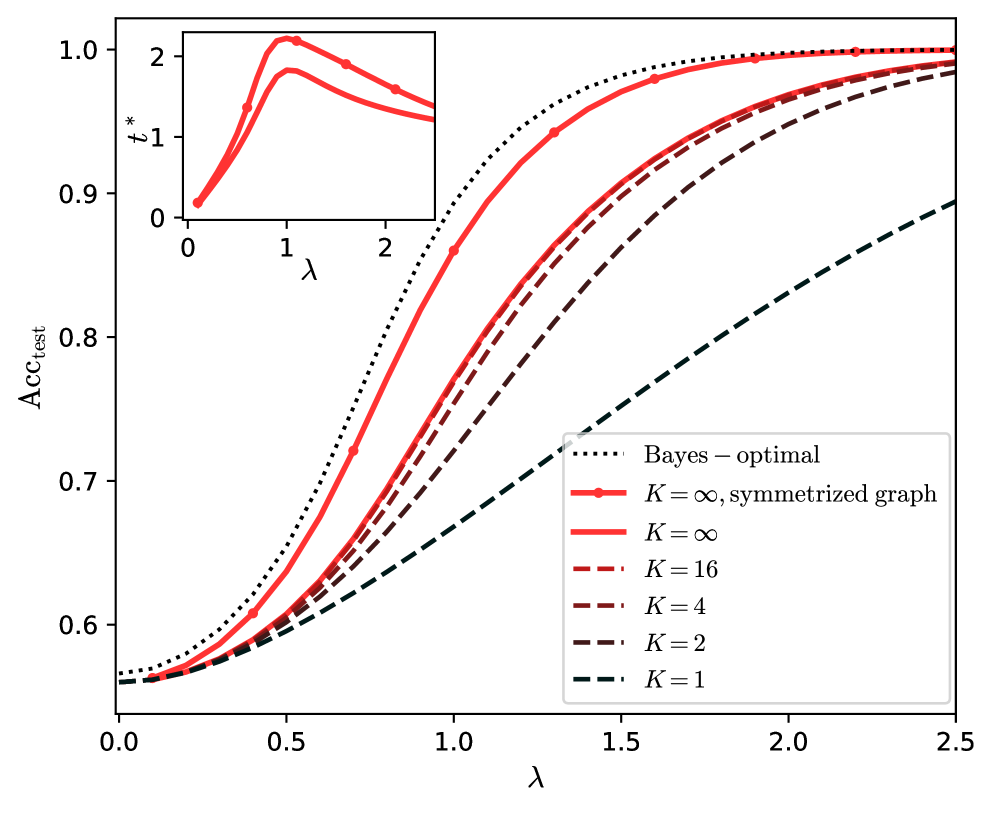
The image is a line chart showing the relationship between test accuracy (Acc_test) and a parameter lambda (λ) for different values of K. An inset plot shows the relationship between t* and lambda. The main chart displays how the accuracy changes with lambda for various K values, including a "Bayes-optimal" baseline.
### Components/Axes
* **Main Chart:**
* **X-axis:** λ (lambda), ranging from 0.0 to 2.5 in increments of 0.5.
* **Y-axis:** Acc_test (Test Accuracy), ranging from 0.6 to 1.0 in increments of 0.1.
* **Legend (bottom-right):**
* Black dotted line: Bayes - optimal
* Red line with dots: K = ∞, symmetrized graph
* Red line: K = ∞
* Brown dashed line: K = 16
* Brown dotted-dashed line: K = 4
* Black dashed line: K = 2
* Black dotted-dashed line: K = 1
* **Inset Chart (top-left):**
* **X-axis:** λ (lambda), ranging from 0 to 2.5 in increments of 1.
* **Y-axis:** t*, ranging from 0 to 2 in increments of 1.
### Detailed Analysis
**Main Chart:**
* **Bayes - optimal (Black dotted line):** Starts at approximately 0.56 and increases rapidly, reaching approximately 0.98 by λ = 1.5, then plateaus near 1.0.
* **K = ∞, symmetrized graph (Red line with dots):** Starts at approximately 0.56, increases rapidly, and reaches approximately 0.99 by λ = 1.5, then plateaus near 1.0.
* **K = ∞ (Red line):** Starts at approximately 0.56, increases rapidly, and reaches approximately 0.98 by λ = 1.5, then plateaus near 0.99.
* **K = 16 (Brown dashed line):** Starts at approximately 0.56, increases steadily, and reaches approximately 0.93 by λ = 2.5.
* **K = 4 (Brown dotted-dashed line):** Starts at approximately 0.56, increases steadily, and reaches approximately 0.88 by λ = 2.5.
* **K = 2 (Black dashed line):** Starts at approximately 0.56, increases steadily, and reaches approximately 0.82 by λ = 2.5.
* **K = 1 (Black dotted-dashed line):** Starts at approximately 0.56, increases steadily, and reaches approximately 0.72 by λ = 2.5.
**Inset Chart:**
* **t* vs. λ (Red lines):** Two red lines are very close to each other. Both start at approximately 0 at λ = 0, increase to a peak around λ = 1 (reaching a value of approximately 2), and then decrease slightly as λ increases further.
### Key Observations
* The Bayes-optimal and K = ∞ curves (both symmetrized and non-symmetrized) achieve the highest accuracy and plateau quickly.
* As K decreases, the accuracy also decreases, and the curves rise more slowly.
* The inset plot shows that t* initially increases with λ, reaches a maximum, and then decreases slightly.
### Interpretation
The chart demonstrates the impact of the parameter lambda (λ) and the value of K on the test accuracy (Acc_test). The Bayes-optimal curve represents the theoretical upper limit of accuracy. The K = ∞ curves closely approach this limit, suggesting that a large K value is beneficial for achieving high accuracy. As K decreases, the accuracy also decreases, indicating that smaller K values lead to poorer performance. The inset plot suggests that there is an optimal value of lambda (λ) for maximizing t*, which is related to the performance of the model. The symmetrized graph performs similarly to the non-symmetrized graph when K is infinite.