## Neural Network Diagram: Signal Processing
### Overview
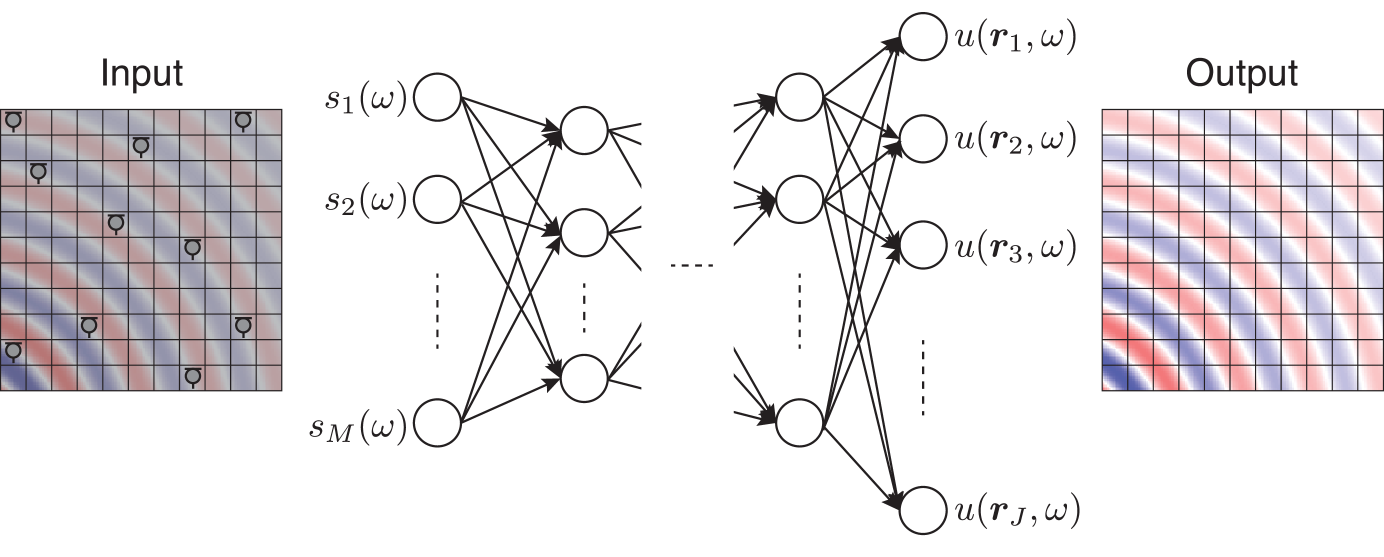
The image depicts a neural network diagram illustrating a signal processing system. It shows an input signal, a multi-layered neural network, and the resulting output signal. The network transforms the input signal through multiple layers of interconnected nodes.
### Components/Axes
* **Input:** A grid representing the input signal. The grid is colored with a sinusoidal pattern alternating between red and blue. Small "omega" symbols are scattered across the grid.
* **Output:** A grid representing the output signal, similar to the input, but with a different sinusoidal pattern.
* **Neural Network:** A multi-layered network connecting the input and output.
* **Input Layer:** Labeled as s1(ω), s2(ω), ..., sM(ω). These represent the input nodes.
* **Hidden Layers:** Two hidden layers are shown, with connections between each layer. The middle section of the network is truncated with dashed lines.
* **Output Layer:** Labeled as u(r1, ω), u(r2, ω), u(r3, ω), ..., u(rJ, ω). These represent the output nodes.
* **Connections:** Lines with arrowheads indicate the flow of information between nodes in adjacent layers.
### Detailed Analysis
* **Input Signal:** The input grid shows a sinusoidal wave pattern. The grid is 9x9. The "omega" symbols are scattered seemingly randomly.
* **Output Signal:** The output grid also shows a sinusoidal wave pattern, but with a different frequency and phase compared to the input. The grid is 9x9.
* **Input Layer Nodes:** The input layer has M nodes, labeled s1(ω) to sM(ω). The exact number of nodes is not specified, but based on the diagram, M is approximately 4.
* **Hidden Layers:** The diagram shows two hidden layers, but the middle section is truncated, suggesting there may be more layers. The number of nodes in each hidden layer is not specified, but appears to be around 4.
* **Output Layer Nodes:** The output layer has J nodes, labeled u(r1, ω) to u(rJ, ω). The exact number of nodes is not specified, but based on the diagram, J is approximately 4.
* **Connections:** Each node in one layer is connected to every node in the next layer, indicating a fully connected network.
### Key Observations
* The diagram illustrates a signal processing system using a neural network.
* The input and output signals are represented as sinusoidal patterns on a grid.
* The neural network transforms the input signal into the output signal through multiple layers of interconnected nodes.
* The network architecture is fully connected.
* The diagram is simplified and does not show the full complexity of a real-world neural network.
### Interpretation
The diagram demonstrates how a neural network can be used to process signals. The input signal is transformed through multiple layers of the network, resulting in a modified output signal. The network learns the relationship between the input and output signals through training, adjusting the weights of the connections between nodes. The "omega" symbol likely represents the frequency component of the signal. The diagram highlights the key components of a neural network-based signal processing system: input representation, network architecture, and output generation. The truncation in the middle suggests that the network can be arbitrarily deep, allowing for complex transformations of the input signal.