\n
## Diagram: Neural Network Architecture
### Overview
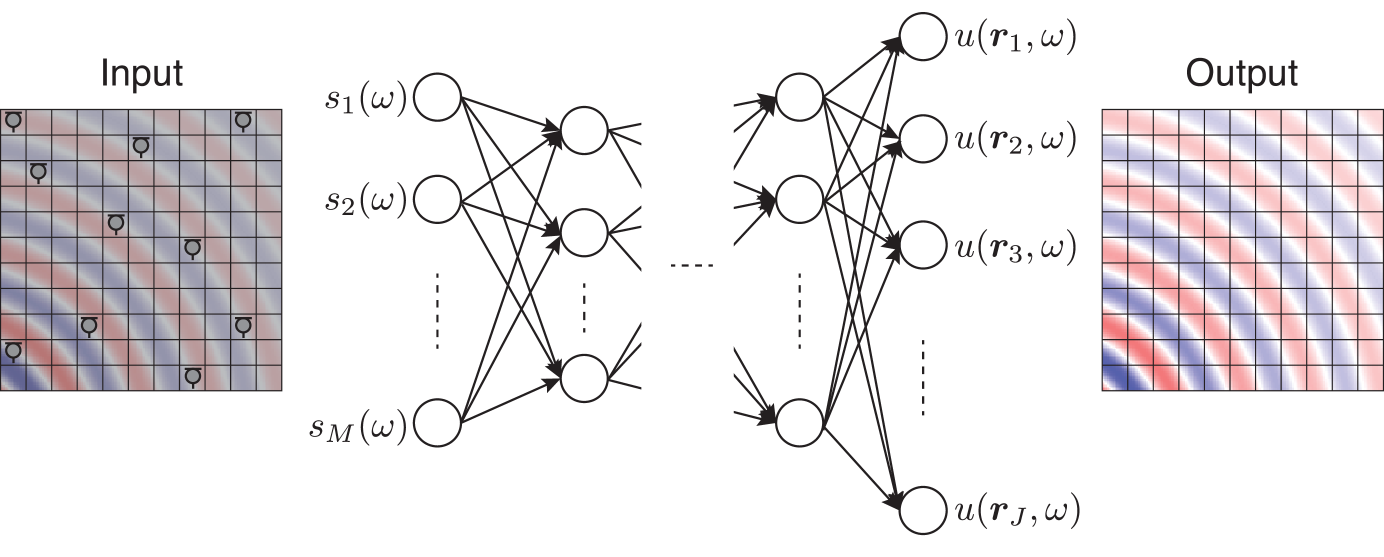
The image depicts a neural network architecture, specifically a multi-layer perceptron (MLP). It illustrates the flow of information from an input layer, through hidden layers, to an output layer. The input and output are represented as grid-like structures, likely representing image data or feature maps. The network consists of multiple nodes connected by weighted edges.
### Components/Axes
The diagram is segmented into three main sections: "Input", a hidden network structure, and "Output".
* **Input:** A grid of approximately 8x8 cells, with varying shades of gray and red. Each cell contains a symbol resembling a stylized "Q".
* **Hidden Layers:** Two hidden layers are visible. The first layer has 'M' nodes labeled as s<sub>1</sub>(ω) through s<sub>M</sub>(ω). The second hidden layer has an unspecified number of nodes.
* **Output:** A grid of approximately 8x8 cells, similar in appearance to the input, with varying shades of gray and red, and containing the same "Q" symbol.
* **Nodes:** Represented as circles.
* **Connections:** Represented as lines connecting nodes between layers.
* **Labels:**
* "Input" - Top-left corner.
* "Output" - Top-right corner.
* s<sub>1</sub>(ω) to s<sub>M</sub>(ω) - Labels for the input nodes of the first hidden layer.
* u(r<sub>1</sub>, ω) to u(r<sub>J</sub>, ω) - Labels for the output nodes.
* ω - Appears in all node labels, likely representing a parameter or weight.
* r<sub>1</sub> to r<sub>J</sub> - Indices for the output nodes.
### Detailed Analysis or Content Details
The diagram shows a fully connected neural network. Each node in the first hidden layer (s<sub>i</sub>(ω)) is connected to every node in the second hidden layer. Similarly, each node in the second hidden layer is connected to every node in the output layer (u(r<sub>j</sub>, ω)).
* **Input Layer:** The input is a grid of 8x8 cells. The color variations and the "Q" symbol within each cell suggest that each cell represents a feature or a pixel value.
* **Hidden Layers:** The first hidden layer has 'M' nodes, where 'M' is not explicitly defined but appears to be approximately 8 based on the visual arrangement. The second hidden layer has 'J' nodes, where 'J' is not explicitly defined but appears to be approximately 4 based on the visual arrangement.
* **Output Layer:** The output is also a grid of 8x8 cells, mirroring the input structure. The color variations and "Q" symbol suggest a transformed representation of the input.
* **Connections:** The connections between layers are dense, indicating a fully connected network. The lines connecting the nodes are not weighted, so the strength of the connections is not visually represented.
* **Node Labels:** The labels s<sub>i</sub>(ω) and u(r<sub>j</sub>, ω) suggest that the nodes represent activations or outputs of the network, parameterized by ω. The 'i' and 'j' indices likely represent the position of the node within its respective layer.
### Key Observations
* The network architecture is symmetrical in terms of input and output dimensions (8x8).
* The use of the symbol "Q" within each cell of the input and output grids is consistent.
* The diagram does not provide any information about the activation functions used in the network.
* The diagram does not show any bias terms.
* The diagram does not show the number of hidden layers.
### Interpretation
The diagram illustrates a basic neural network designed to transform an input grid into an output grid. The network learns a mapping between the input and output through the adjustment of weights (represented by ω) during training. The "Q" symbol within each cell could represent a specific feature or pattern that the network is designed to recognize or manipulate. The color variations in the input and output grids suggest that the network is performing some form of feature extraction or transformation. The network could be used for tasks such as image recognition, image reconstruction, or pattern classification. The absence of specific details about the network's parameters and training process limits the ability to draw more specific conclusions. The diagram is a conceptual representation of a neural network architecture and does not provide any quantitative data about its performance.