## Line Graph: Model Risk and Probability Over Training Time
### Overview
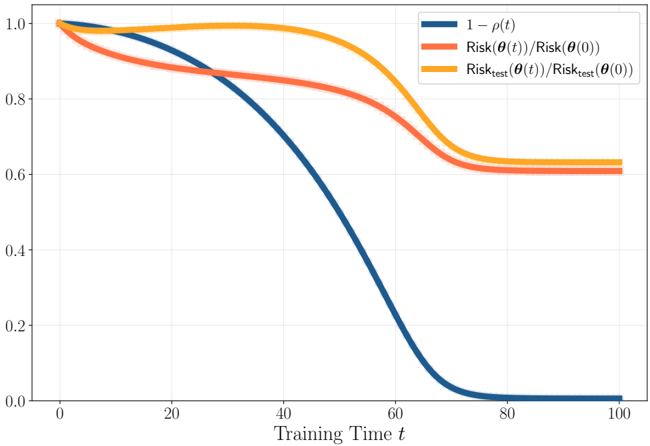
The graph depicts three metrics over training time (t) from 0 to 100:
1. **1 - ρ(t)** (blue line): Likely represents confidence or error rate reduction.
2. **Risk(θ(t))/Risk(θ(0))** (orange line): Training risk ratio relative to initial risk.
3. **Risk_test(θ(t))/Risk_test(θ(0))** (red line): Test risk ratio relative to initial test risk.
### Components/Axes
- **X-axis**: "Training Time t" (0–100, linear scale).
- **Y-axis**: Unitless ratio (0.0–1.0, increments of 0.2).
- **Legend**: Top-right corner, with three entries:
- Blue: `1 - ρ(t)`
- Orange: `Risk(θ(t))/Risk(θ(0))`
- Red: `Risk_test(θ(t))/Risk_test(θ(0))`
### Detailed Analysis
1. **Blue Line (1 - ρ(t))**:
- Starts at 1.0 (t=0), drops sharply to ~0.2 by t=60, then plateaus near 0.
- Suggests rapid improvement in a metric (e.g., error rate) during early training.
2. **Orange Line (Training Risk Ratio)**:
- Begins at ~0.98 (t=0), declines gradually to ~0.6 by t=80, then stabilizes.
- Indicates diminishing returns in training risk reduction after ~40 units of training.
3. **Red Line (Test Risk Ratio)**:
- Starts at 1.0 (t=0), dips to ~0.95 by t=20, then rises to ~0.65 by t=80.
- Shows initial improvement in test risk, followed by stabilization at a higher value than training risk.
### Key Observations
- All lines start near 1.0, reflecting baseline risk/confidence.
- **Blue line** declines fastest, implying rapid early gains in the modeled metric.
- **Test risk (red)** plateaus higher than training risk (orange), suggesting potential overfitting.
- **Training risk (orange)** shows smoother convergence compared to test risk.
### Interpretation
- The sharp drop in `1 - ρ(t)` (blue) may represent a confidence threshold or error rate reduction, peaking early in training.
- The divergence between training and test risk ratios (orange vs. red) highlights a gap in generalization, with test risk stabilizing at ~0.65 vs. training risk at ~0.6. This could indicate overfitting or dataset shift.
- The plateauing behavior of all lines after ~60–80 training steps suggests diminishing returns, where further training yields minimal improvements.
## Critical Notes
- **Legend Accuracy**: Colors match lines exactly (blue=blue, orange=orange, red=red).
- **Spatial Grounding**: Legend is top-right; axes are labeled with clear increments.
- **No Outliers**: All lines follow smooth, expected trends without anomalies.
- **Language**: English only; no non-English text present.