## Combined Bar and Line Chart: STFT and SNR vs. Percentage of Binaural Audios
### Overview
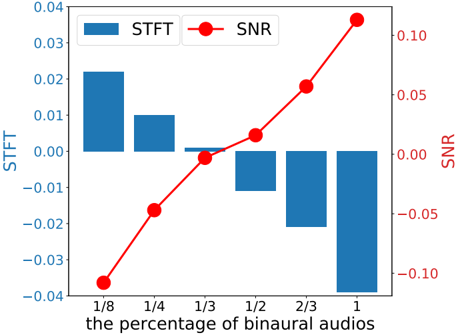
The image is a combined bar and line chart comparing the Short-Time Fourier Transform (STFT) and Signal-to-Noise Ratio (SNR) against the percentage of binaural audios. The STFT data is represented by blue bars, while the SNR data is represented by a red line with circular markers. The x-axis represents the percentage of binaural audios, and there are two y-axes: one for STFT on the left and one for SNR on the right.
### Components/Axes
* **X-axis:** "the percentage of binaural audios" with categories: 1/8, 1/4, 1/3, 1/2, 2/3, 1
* **Left Y-axis:** "STFT" with a scale from -0.04 to 0.04, incrementing by 0.01.
* **Right Y-axis:** "SNR" with a scale from -0.10 to 0.10, incrementing by 0.05.
* **Legend:** Located at the top-left of the chart.
* Blue: STFT (represented as bars)
* Red: SNR (represented as a line with circular markers)
### Detailed Analysis
* **STFT (Blue Bars):**
* At 1/8: STFT value is approximately 0.022.
* At 1/4: STFT value is approximately 0.010.
* At 1/3: STFT value is approximately 0.001.
* At 1/2: STFT value is approximately -0.011.
* At 2/3: STFT value is approximately -0.021.
* At 1: STFT value is approximately -0.035.
* Trend: The STFT values generally decrease as the percentage of binaural audios increases.
* **SNR (Red Line):**
* At 1/8: SNR value is approximately -0.095.
* At 1/4: SNR value is approximately -0.045.
* At 1/3: SNR value is approximately 0.005.
* At 1/2: SNR value is approximately 0.030.
* At 2/3: SNR value is approximately 0.060.
* At 1: SNR value is approximately 0.110.
* Trend: The SNR values consistently increase as the percentage of binaural audios increases.
### Key Observations
* The STFT values start positive and decrease to negative values as the percentage of binaural audios increases.
* The SNR values start negative and increase to positive values as the percentage of binaural audios increases.
* There is an inverse relationship between STFT and SNR as the percentage of binaural audios changes.
### Interpretation
The chart suggests that as the percentage of binaural audios increases, the Signal-to-Noise Ratio (SNR) improves, while the Short-Time Fourier Transform (STFT) values decrease. This could indicate that a higher percentage of binaural audio leads to a clearer signal with less noise, as reflected by the increasing SNR. The decreasing STFT values might be related to changes in the frequency content or characteristics of the audio signal as it becomes more binaural. The inverse relationship between STFT and SNR highlights a potential trade-off or interaction between these two audio characteristics in the context of varying binaural audio percentages.